Fig. 10
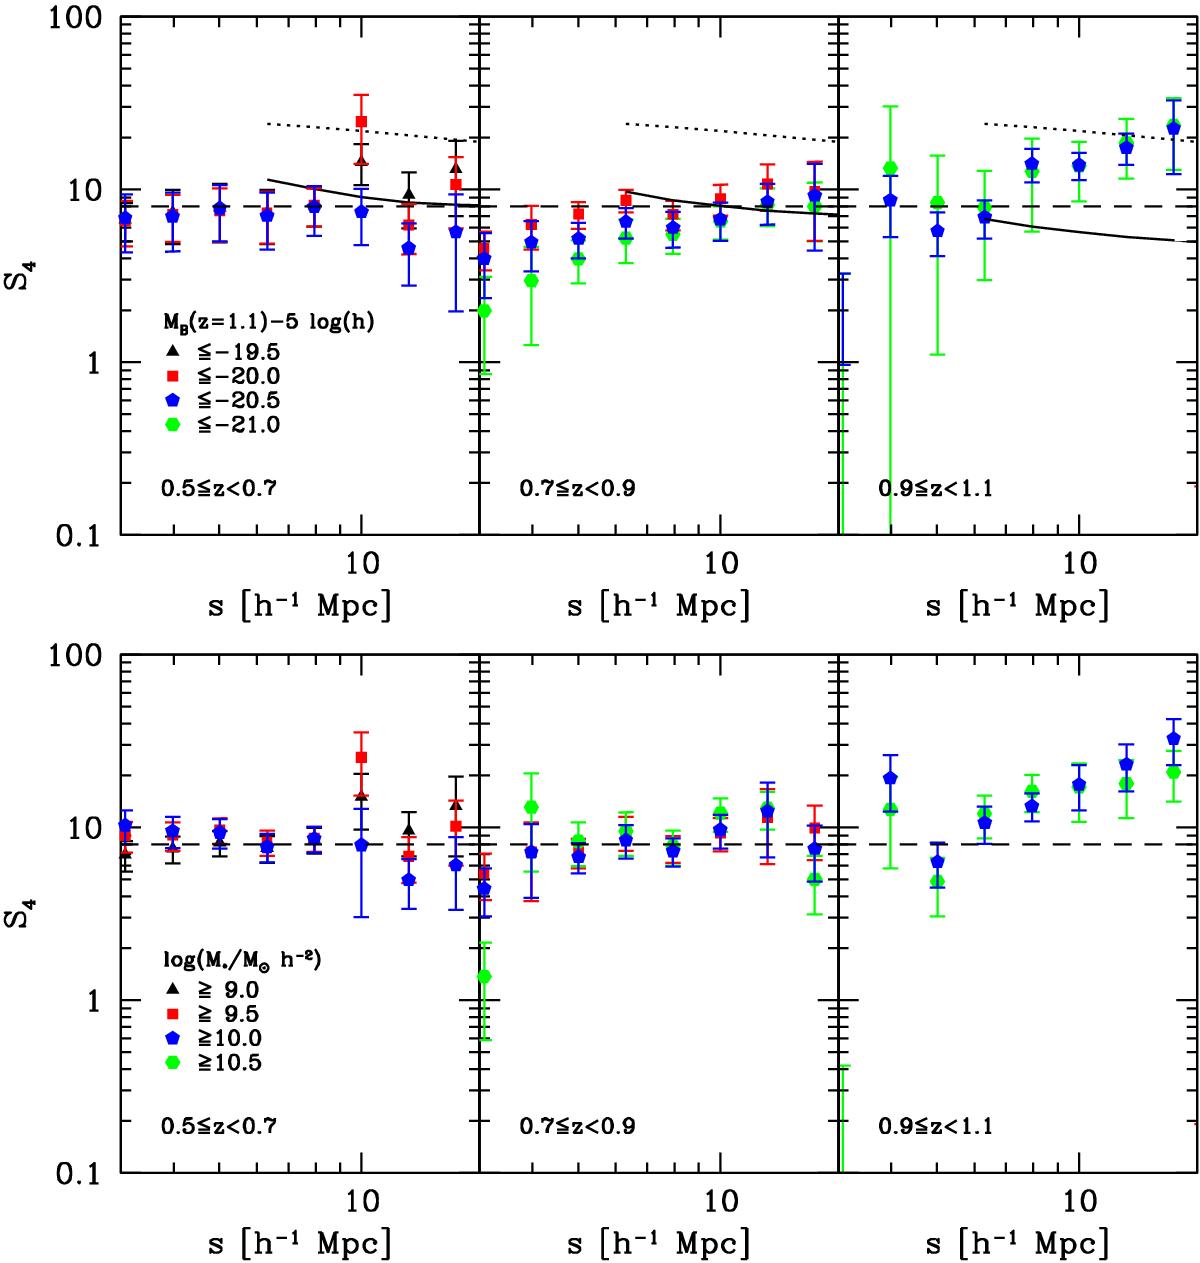
Normalized skewness S4 as a function of the B absolute luminosity (upper panels) and stellar mass (lower panels). The limits of the subsamples in absolute magnitude and stellar mass are shown in the left upper and lower panels (symbols and colours are the same as in Fig. 4). We note that black points corresponding to galaxies with M< −19.50 or M∗ ≥ 9.0 M⊙ are only plotted for the first redshift bin ([0.5, 0.7]), but most of them are not visible as they lie below the points of the other samples. The dashed line corresponds to S4 = 8. In the top panels, the dotted line is the prediction from second-order perturbation theory for the matter distribution in real space; the solid line is the prediction of S4 for galaxies with MB(z = 1.1) − 5log (h) ≤ −20.5 (to be compared to blue pentagons): it was obtained from the matter values, converted to redshift space and divided by the corresponding linear bias factor.
Current usage metrics show cumulative count of Article Views (full-text article views including HTML views, PDF and ePub downloads, according to the available data) and Abstracts Views on Vision4Press platform.
Data correspond to usage on the plateform after 2015. The current usage metrics is available 48-96 hours after online publication and is updated daily on week days.
Initial download of the metrics may take a while.