Fig. 1
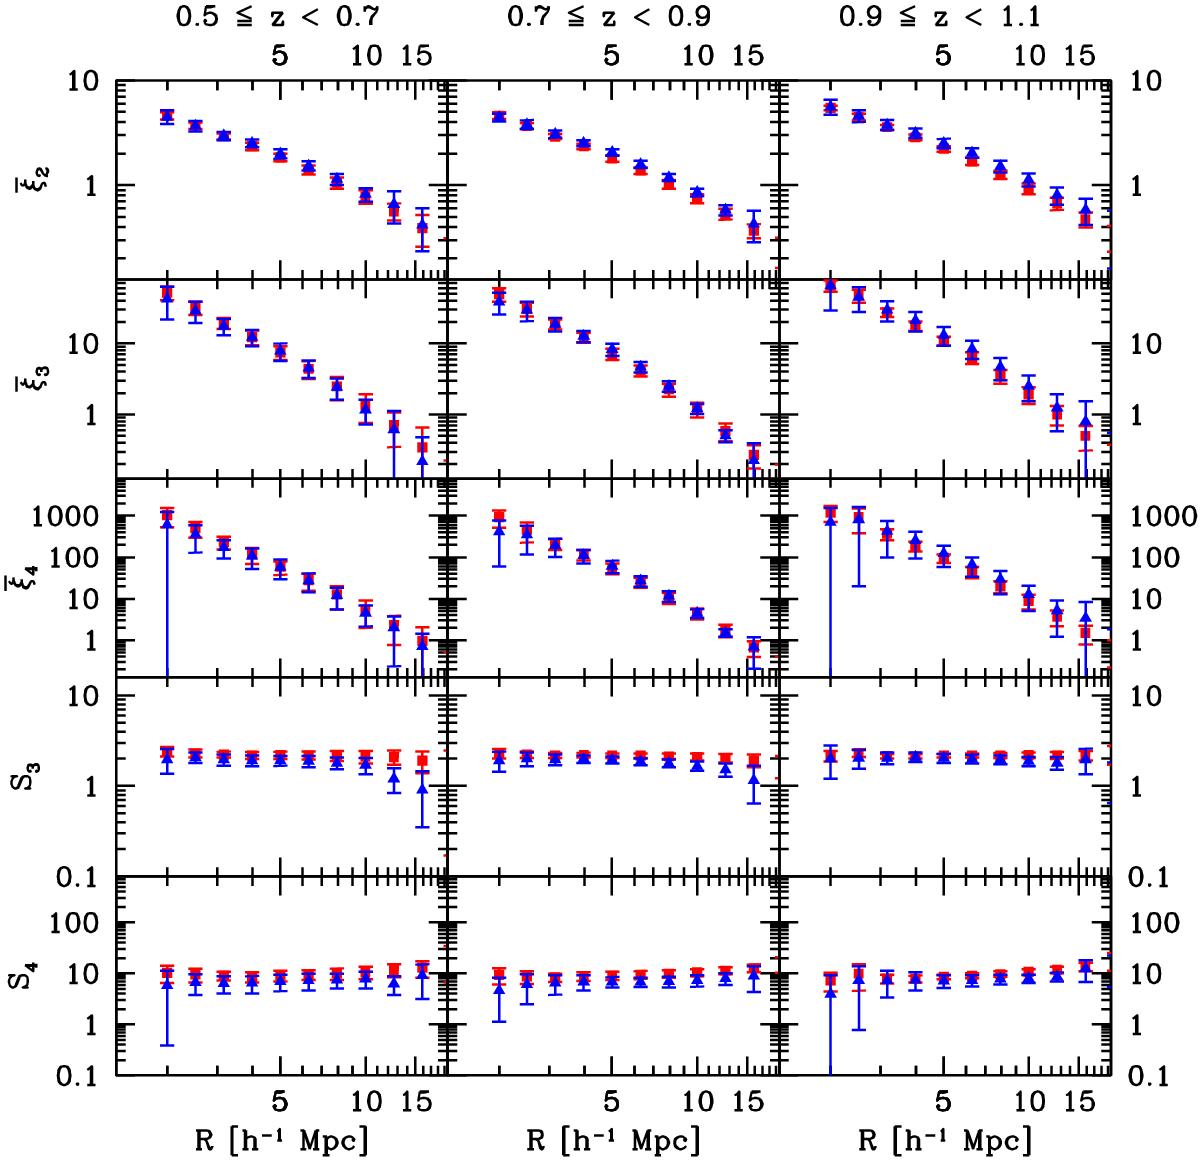
Comparison between mock catalogues with a sampling rate of 100% and without gaps (red triangles), and with a sampling rate and gaps as in VIPERS (blue triangles). The subsamples are limited at MB(z = 1.1) − 5log (h) ≤ −20.5. From top to bottom: volume-averaged two-, three-, and four-point correlation functions, normalized skewness S3 and kurtosis S4 in redshift space. First column: 0.5 ≤ z< 0.7; second column: 0.7 ≤ z< 0.9; third column: 0.9 ≤ z< 1.1.
Current usage metrics show cumulative count of Article Views (full-text article views including HTML views, PDF and ePub downloads, according to the available data) and Abstracts Views on Vision4Press platform.
Data correspond to usage on the plateform after 2015. The current usage metrics is available 48-96 hours after online publication and is updated daily on week days.
Initial download of the metrics may take a while.