Fig. 2
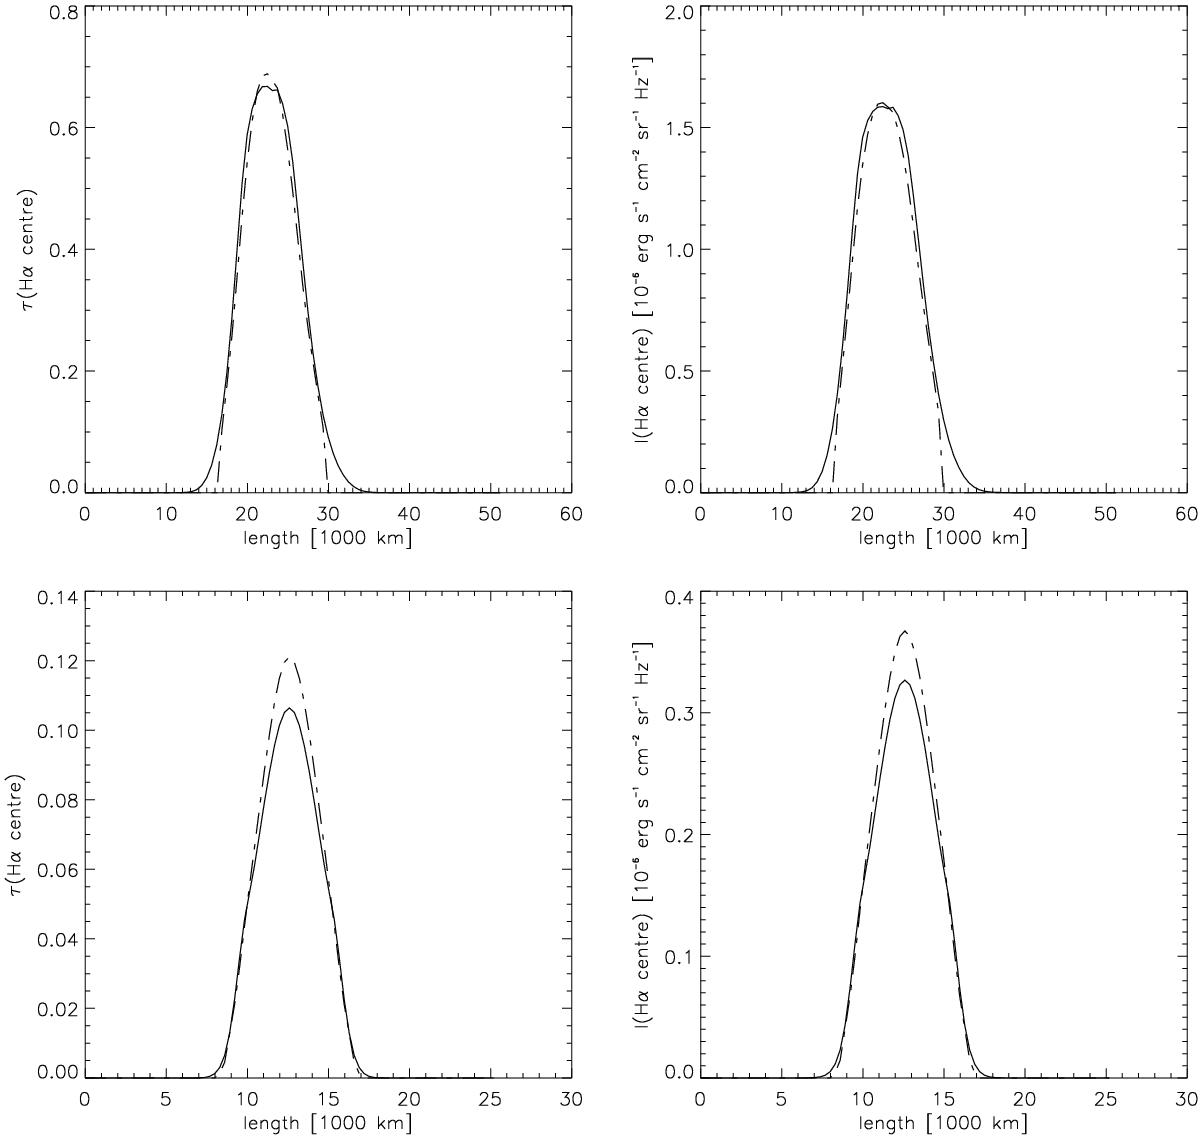
Optical thickness (left column) and intensity (right column) at the Hα line center plotted along the length of the 2D plasma structure of the Deep_dip (upper row) and the Model_dem (lower row). Solid lines represent the 2D non-LTE radiative transfer calculations, while the dash-dotted lines show the results of the approximate Hα synthesis with the interpolation of i and f.
Current usage metrics show cumulative count of Article Views (full-text article views including HTML views, PDF and ePub downloads, according to the available data) and Abstracts Views on Vision4Press platform.
Data correspond to usage on the plateform after 2015. The current usage metrics is available 48-96 hours after online publication and is updated daily on week days.
Initial download of the metrics may take a while.