Fig. 1
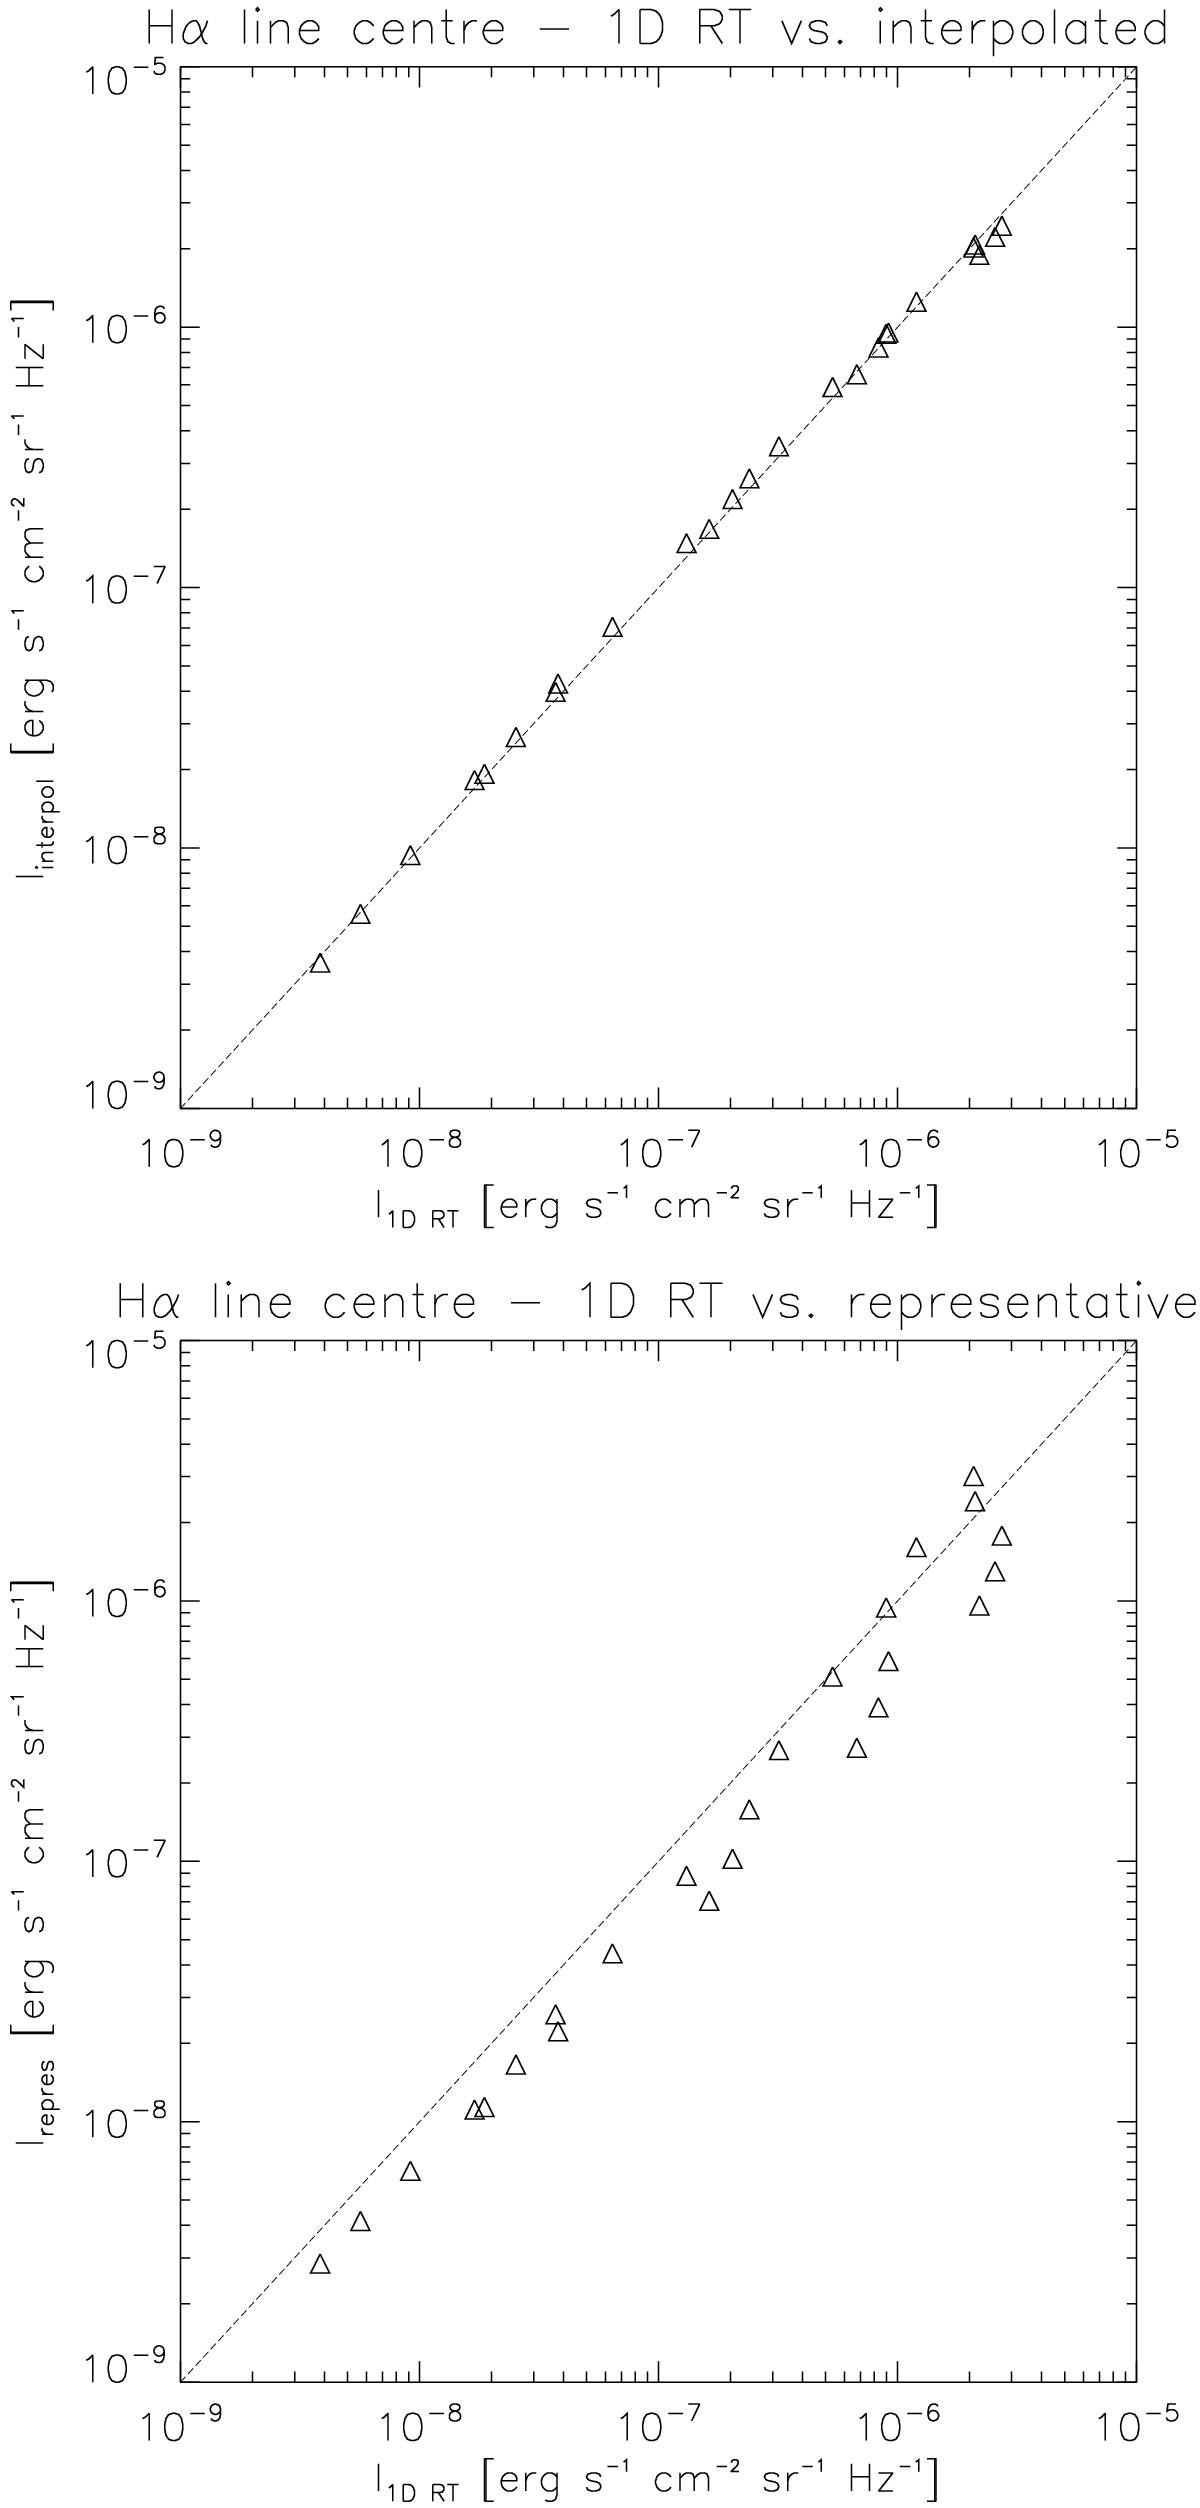
Scatterplots of the Hα line center intensities obtained by 1D non-LTE computations (x-axes) and by approximate synthesis using i and f interpolation (top) and using fixed representative i and f values (bottom). Dashed lines correspond to the precise match with the intensities obtained by 1D non-LTE computations.
Current usage metrics show cumulative count of Article Views (full-text article views including HTML views, PDF and ePub downloads, according to the available data) and Abstracts Views on Vision4Press platform.
Data correspond to usage on the plateform after 2015. The current usage metrics is available 48-96 hours after online publication and is updated daily on week days.
Initial download of the metrics may take a while.