Fig. 5
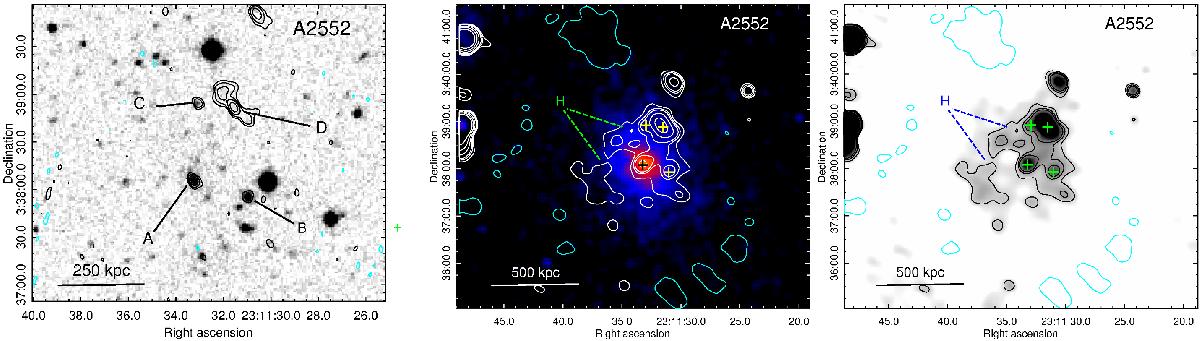
A2552: Left: GMRT 610 MHz high resolution image in contours overlaid on the DSS POSS II R band image in grey scale. The contours are at −0.15,0.15,0.30,0.60,1.2 mJy beam-1, and the beam is 5.5′′ × 4.3′′, p.a. 35.9°. Middle: The 610 MHz low resolution (LR, 15′′ × 15′′) image in contours (white +ve and cyan −ve) overlaid on the Chandra X-ray image (Obs ID 11730, 0.5−2 keV and resolution ~4′′) in colour. The contours are at 0.4,0.6,0.8,1.6,3.2,6.4 mJy beam-1. The discrete sources are marked by “+”, and H points out the patches of diffuse emission. Right: the 610 MHz LR image in grey-scale and the contours same as in the middle panel (black +ve and cyan −ve) are overlaid.
Current usage metrics show cumulative count of Article Views (full-text article views including HTML views, PDF and ePub downloads, according to the available data) and Abstracts Views on Vision4Press platform.
Data correspond to usage on the plateform after 2015. The current usage metrics is available 48-96 hours after online publication and is updated daily on week days.
Initial download of the metrics may take a while.