Fig. 12
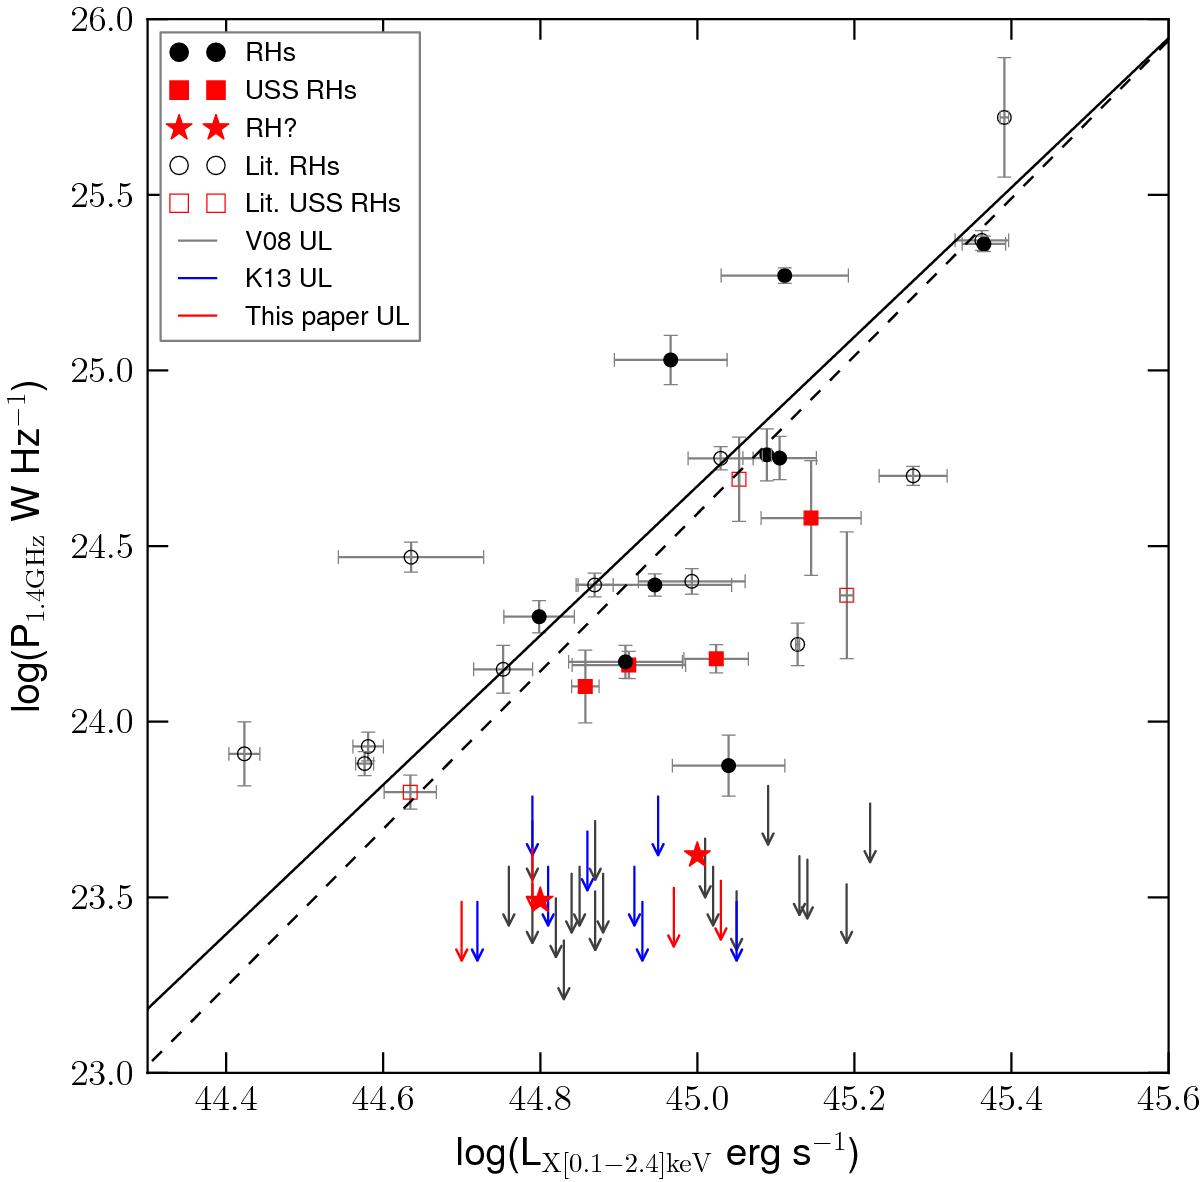
Radio haloes and the upper limits (UL) in the GRHS and EGRHS sample are shown in the P1.4 GHz−LX diagram, along with the literature radio haloes listed in Cassano et al. (2013). The filled symbols are for radio haloes that belong to the GRHS and EGRHS sample, and the empty symbols are for the literature radio haloes. The squares are the USS radio haloes. The arrows show the upper limits from the current (red) and previous works (grey, V08 and blue, K13). The best fit lines to the radio haloes excluding the USS radio haloes (solid) and including the USS radio haloes (dashed) are also plotted.
Current usage metrics show cumulative count of Article Views (full-text article views including HTML views, PDF and ePub downloads, according to the available data) and Abstracts Views on Vision4Press platform.
Data correspond to usage on the plateform after 2015. The current usage metrics is available 48-96 hours after online publication and is updated daily on week days.
Initial download of the metrics may take a while.