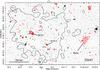
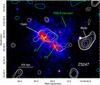
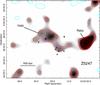
Fig. 1
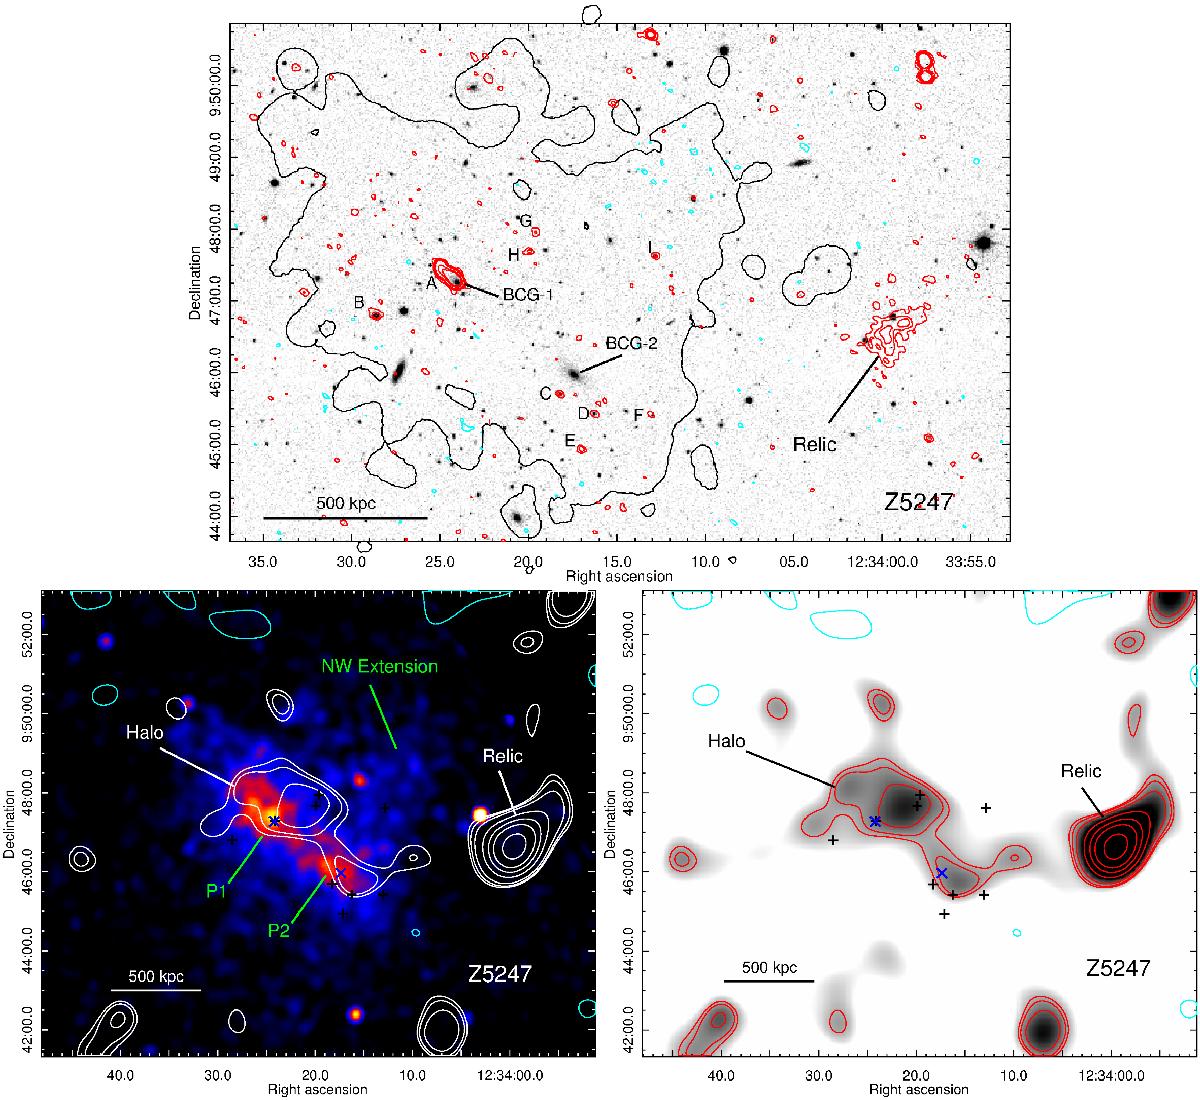
Z5247: Top: GMRT 610 MHz high resolution image in contours (red +ve and cyan −ve) overlaid on SDSS r-band image in grey-scale. The contours are at −0.09,0.09,0.18,0.36,0.72,1.44,2.88,5.76 mJy beam-1. The beam at 610 MHz is 6.2′′ × 5.2′′, p.a. 56°. The discrete radio sources in the cluster region (A to I), the relic and the two BCGs (1 and 2) are labelled. The extent of the X-ray emission from the cluster ICM is shown by the black contour. Bottom left: the Chandra X-ray image (Obs ID 11727, 0.5−2 keV and resolution ~4′′) of Z5247 is shown in colour overlaid with the contours of the 60′′×60′′ resolution 610 MHz image (black +ve and cyan −ve) made after the subtraction of the discrete sources. The contours are at −0.9,0.9,1,1.2,1.8,2.4,3,4 mJy beam-1. The features in the X-rays are labelled in green (P1, P2 and NW Extension) and the positions of the BCGs (“×”) and of the discrete radio sources (“+”) are marked. Bottom right: the 60′′ × 60′′ resolution 610 MHz image is shown in grey-scale with the same contours as in the left panel.
Current usage metrics show cumulative count of Article Views (full-text article views including HTML views, PDF and ePub downloads, according to the available data) and Abstracts Views on Vision4Press platform.
Data correspond to usage on the plateform after 2015. The current usage metrics is available 48-96 hours after online publication and is updated daily on week days.
Initial download of the metrics may take a while.