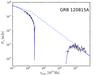
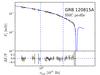
Fig. 1

Rest-frame afterglow SED analysis of GRB 120815A. Broadband SED is shown in the left plot. Optical and X-ray data are plotted with black points, the best-fitted model is plotted with solid blue lines and the intrinsic afterglow spectrum with dashed-blue line. Zoomed part of the X-Shooter SED is shown in the right plot, where residuals to the best-fitted model are also shown. Vertical lines divide the spectral regions covered by the NIR, VIS, and UVB spectrograph arm. Orange points are photometric observations used to calibrate the absolute flux of the spectrum. References for photometric data points and details on the fitting procedure are reported in Sect. 3. Similar plots for other GRBs in our sample are shown in Figs. 2 and 3.
Current usage metrics show cumulative count of Article Views (full-text article views including HTML views, PDF and ePub downloads, according to the available data) and Abstracts Views on Vision4Press platform.
Data correspond to usage on the plateform after 2015. The current usage metrics is available 48-96 hours after online publication and is updated daily on week days.
Initial download of the metrics may take a while.