Free Access
Fig. 5
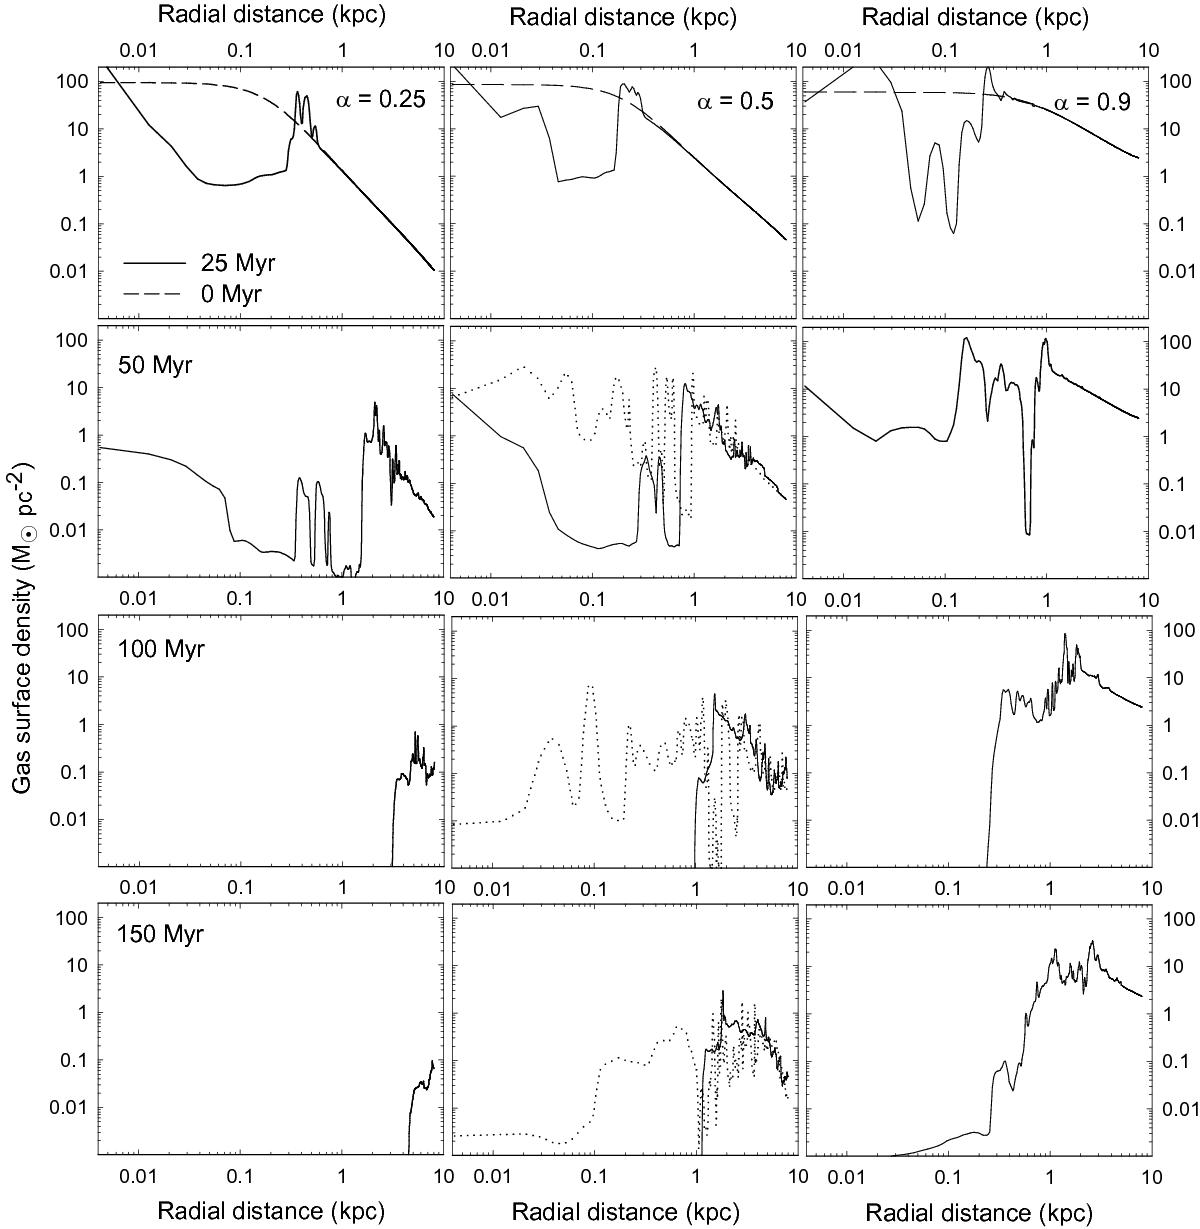
Gas surface density as a function of radius for the same models and at the same moments in time as in Fig. 4. In the upper panels, the initial density distribution is also indicated (dashed lines). The dotted lines in the middle column also show the distribution for the α = 0.5 model without stellar motion (see Sect. 5.2).
Current usage metrics show cumulative count of Article Views (full-text article views including HTML views, PDF and ePub downloads, according to the available data) and Abstracts Views on Vision4Press platform.
Data correspond to usage on the plateform after 2015. The current usage metrics is available 48-96 hours after online publication and is updated daily on week days.
Initial download of the metrics may take a while.