Free Access
Fig. A.4
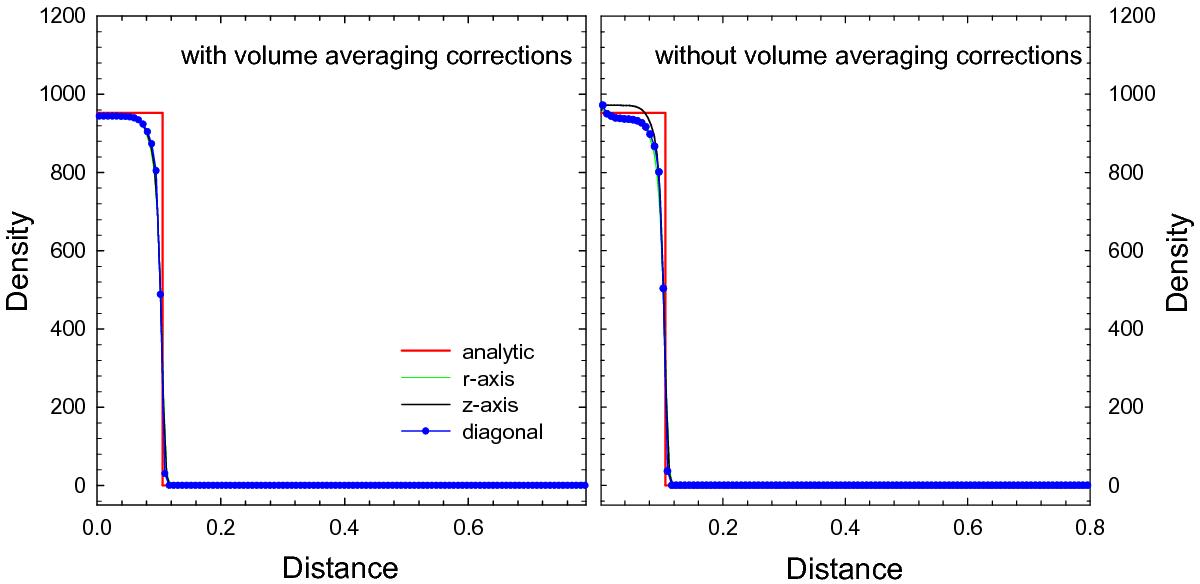
Collapse of a pressure-free sphere showing the gas density at 0.985 that of the free-fall time. The left and right panels show the test results with and without the volume averaging corrections as described in Blondin & Lufkin (1993). The line meaning is the same as in Fig. A.2.
Current usage metrics show cumulative count of Article Views (full-text article views including HTML views, PDF and ePub downloads, according to the available data) and Abstracts Views on Vision4Press platform.
Data correspond to usage on the plateform after 2015. The current usage metrics is available 48-96 hours after online publication and is updated daily on week days.
Initial download of the metrics may take a while.