Fig. 3
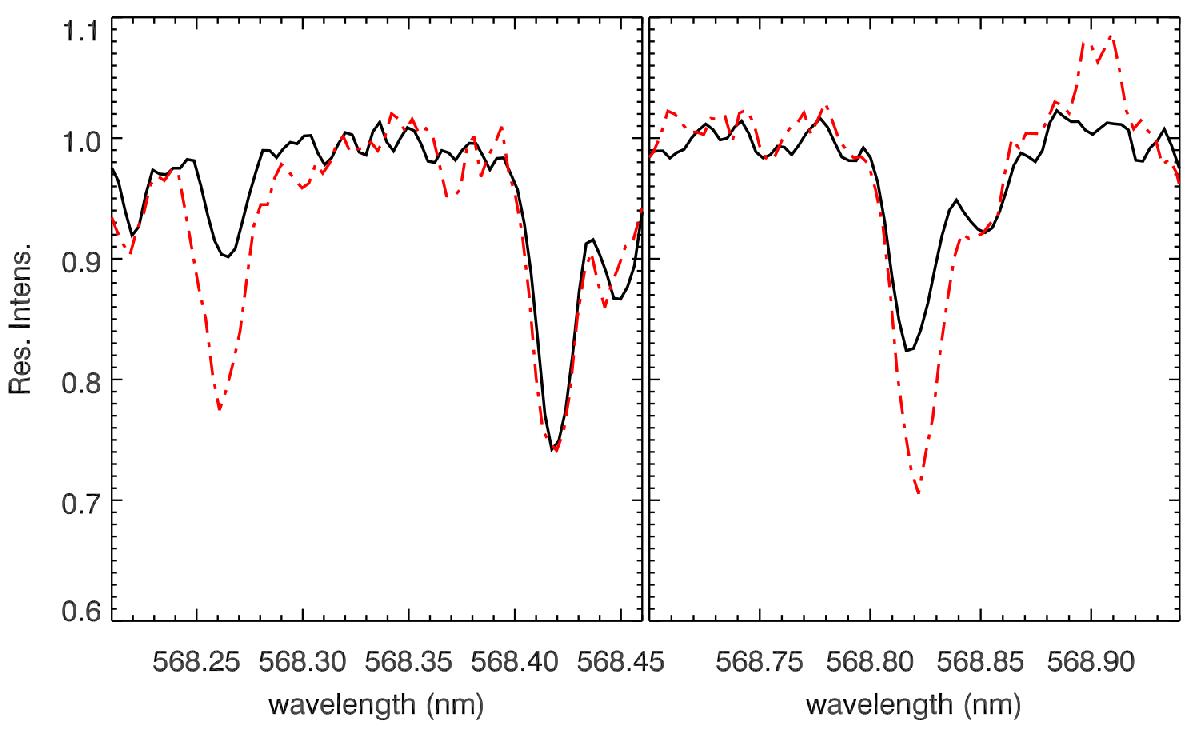
Left panel: Na i 568.2 nm line and Sc ii 568.4 nm lines in the spectra of stars NGC 5634-2 (black solid line) and NGC 5634-3 (red dash-dotted line). The MyGIsFOS fit to this specific feature is [Na/H] = −2.22 for NGC 5634-2, and −1.72 for NGC 5634-3. Right panel: Na i 568.8 nm line in the same stars. Abundances here are [Na/H] = −2.15 and −1.76. The remarkable difference in Na abundance between the two stars is quite evident.
Current usage metrics show cumulative count of Article Views (full-text article views including HTML views, PDF and ePub downloads, according to the available data) and Abstracts Views on Vision4Press platform.
Data correspond to usage on the plateform after 2015. The current usage metrics is available 48-96 hours after online publication and is updated daily on week days.
Initial download of the metrics may take a while.