Fig. A.1
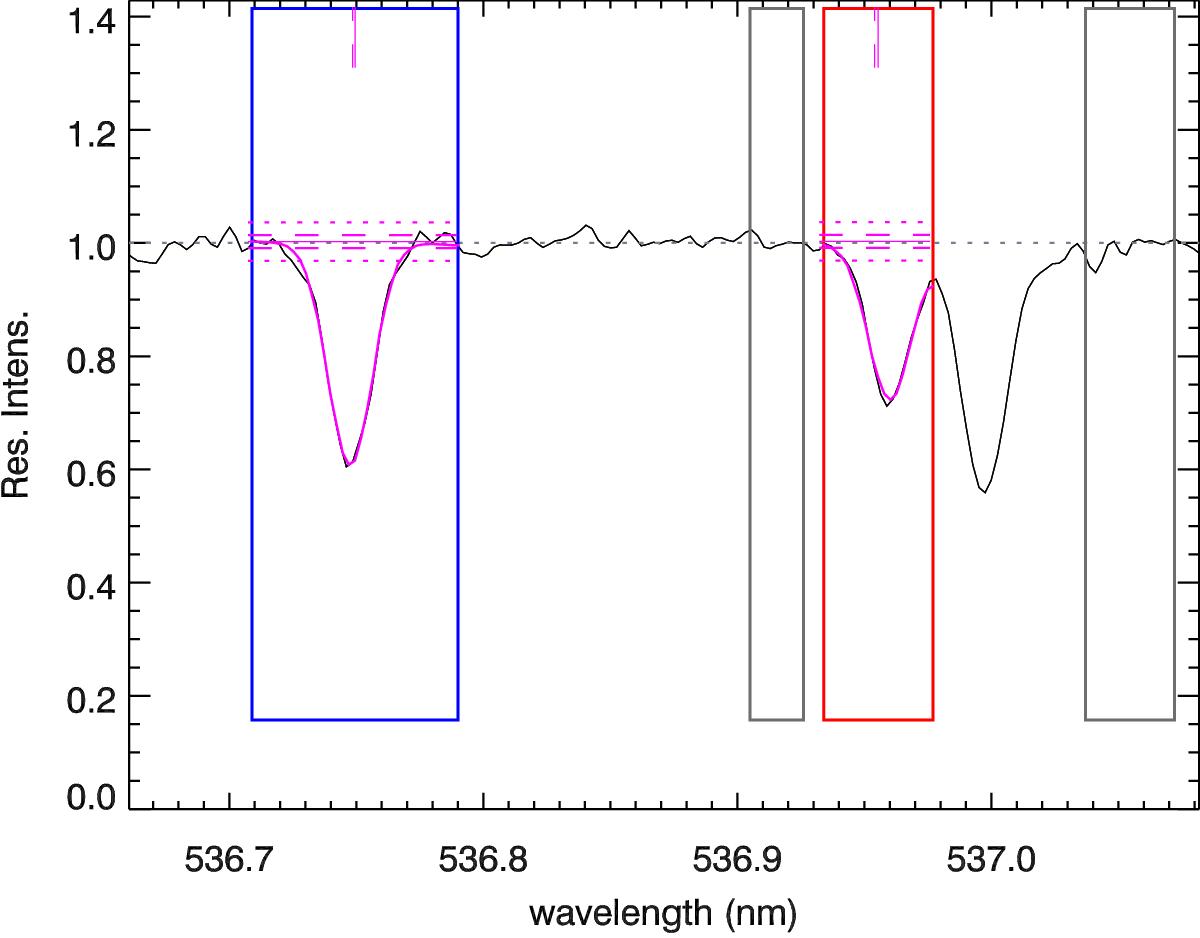
An example of MyGIsFOS fit for two features of star NGC 5634-2. The blue box corresponds to a Fe i feature, while the red box is a Co i feature. Gray boxes are pseudo-continuum estimation intervals. Observed pseudo-normalized spectrum is in black; magenta profiles are best-fitting profiles for each region. The black dotted horizontal line is the pseudo-continuum level, while the continuous thin magenta horizontal line represents the best-fit continuum for the feature. Around it, dashed and dotted horizontal magenta lines represent 1σ and 3σ intervals of the local noise (S/N = 88 in this area). Vertical dashed and continuous lines mark the theoretical feature center, and the actual center after the best-fit, per-feature Doppler shift has been applied.
Current usage metrics show cumulative count of Article Views (full-text article views including HTML views, PDF and ePub downloads, according to the available data) and Abstracts Views on Vision4Press platform.
Data correspond to usage on the plateform after 2015. The current usage metrics is available 48-96 hours after online publication and is updated daily on week days.
Initial download of the metrics may take a while.