| Issue |
A&A
Volume 579, July 2015
|
|
|---|---|---|
| Article Number | A78 | |
| Number of page(s) | 5 | |
| Section | Planets and planetary systems | |
| DOI | https://doi.org/10.1051/0004-6361/201425461 | |
| Published online | 01 July 2015 | |
The recent dynamical history of comet 67P/Churyumov-Gerasimenko
ESA/ESAC, PO Box 78, 28691 Villanueva de la Cañada, Spain
e-mail: This email address is being protected from spambots. You need JavaScript enabled to view it.
Received: 4 December 2014
Accepted: 13 April 2015
Abstract
This paper presents the past evolution of the orbital elements of comet 67P/Churyumov-Gerasimenko, target of the Rosetta spacecraft. The gravitational orbit of the comet is affected by the sublimation of ice from the nucleus that triggers non-gravitational forces. The comet also experienced several close encounters with Jupiter, especially notable were those in 1959 and 1923 (less than 1 AU). These perturbations cause the chaoticity of the comet orbit at short time scale. The goal of this paper is to have a precise idea of the comet’s recent dynamical history. This is done by studying the mean trends of the orbital elements of the comet and also by characterising its chaotic motion with the fast Lyapunov indicator. To compute these mean trends, two sets (considering or not the non-gravitational forces) of 1000 clone orbits of the comet were considered. This paper shows that the last close encounter with Jupiter on February 4, 1959, drastically modified the orbital elements of the comet (especially the perihelion distance: from more than 2.7 AU before the encounter to 1.3 AU after the encounter). The motion of the comet is also shown to be chaotic before the close encounter with Jupiter on October 2, 1923. The mean trends of the orbital elements of the comet are also presented in this paper (for two time scales: 270 years in the past and 10 000 years in the past).
Key words: chaos / celestial mechanics / comets: individual: 67P/Churyumov-Gerasimenko
© ESO, 2015
1. Introduction
The Rosetta spaceprobe is currently orbiting around the nucleus of the comet 67P/Churyumov-Gerasimenko (67P in the following text). One of the major goals of its mission is to study the comet during its active phase around the Sun. The orbit of the comet is affected by the sublimation of the ice off the nucleus. When the comet approaches the Sun, this outgassing triggers a non-gravitational force (NGF) that significantly modifies its orbit. Moreover, during its past orbits, comet 67P had several close encounters with the planet Jupiter. Because of these perturbations, the orbit of 67P is chaotic. This chaoticity was already revealed by Krolikowska (2003) who integrated 20 orbits of random clones of the comet and used different non-gravitational models, and by Groussin et al. (2007) who integrated 18 clones with nine different values of the initial mean anomaly, considering or not the NGF.
Unlike these previous studies, the goal of this paper is to show the mean past evolution of different orbital elements (taking into account 1000 clones with NGF and another 1000 clones without NGF) to better understand what is actually being observed by Rosetta. Indeed, providing the mean trends of the orbital elements is necessary for the different instrasec descriptions of the comet such as its formation, its structure, and its erosion. In this work, the chaoticity of the comet motion is also highlighted by computing the fast Lyapunov indicator (FLI) using the strategy explained in Fouchard et al. (2002; for a review of this indicator, see Fouchard et al. 2002, and references therein).
The paper is organised as follows:
Section 2 presents the equation of motion used to integrate the comet motion and how the initial conditions are chosen. Section 3 shows the results of the integrations and how chaotic the motion of the comet is by computing the FLI. Conclusions are given in Sect. 4.
2. Modelling
2.1. Equation of motion
The dynamical evolution of 67P is investigated by numerically integrating a two-body problem (sun and comet) perturbed by the eight planets of the solar system. The positions of the planets are given by the planetary theory INPOP 13 (Fienga et al. 2014) provided by the Institut de Mécanique Céleste et de Calcul des Éphémérides. A solution of this planetary theory covering the time needed by this study (50 000 years) was specially provided for this work by IMCCE. The non-gravitational force due to the cometary outgassing is introduced in the equation of motion as Marsden et al. (1973). The non-gravitational perturbing acceleration is given by its radial, transverse, and normal components in the equatorial heliocentric frame as  (1)where
 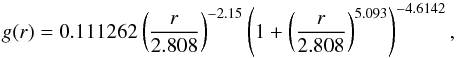 (2)and A1,A2,A3 are constants obtained by fitting the astrometrical positions of the considered comet together with the orbital elements. The vector eR, eT, and eN are the radial, transverse, and normal direction vectors, respectively. The dimensionless function g(r) represents the variation in the sublimation rate as a function of the heliocentric distance of the comet r. According to Fig. 1 generated from Eq. (2), we note that the activity begins to be significant toward the sun around 2.7 au which is the snow line of the solar system (Abe et al. 2000; Morbidelli et al. 2000). According to Tubiana et al. (2015), the activity of 67P began before the snow line, but was not strong enough to affect the dynamic and be detected by orbital computation.
The acceleration due to relativistic effects is also introduced because of the proximity of the comet to the sun during the perihelion passage. The relativistic effects are comparable in terms of magnitude to the non-gravitational forces (Maquet 2012). Moreover, the non-gravitational parameters given in Table 1 were determined by fitting a model that included these effects, which is why it is very important to take these effects into account. This acceleration is given by Beutler (2005), ![Mathematical equation: \begin{equation} \vec{A}_{\rm GR}= \frac{k^2}{c^2r^3}\left[\left(4\frac{k^2}{r^3}-\left(\frac{{\rm d}\vec{r}}{{\rm d}t}\right)^2\right)\vec{r}+4\left(\vec{r}.\frac{{\rm d}\vec{r}}{{\rm d}t}\right)\frac{{\rm d}\vec{r}}{{\rm d}t}\right], \end{equation}](/articles/aa/full_html/2015/07/aa25461-14/aa25461-14-eq9.png) (3)where r is the heliocentric position vector of the comet, k is the Gauss gravitational constant, and c the velocity of light. I formulate the equation of motion in an equatorial heliocentric frame where the variables are the cartesian coordinates of the position of the comet. The equations of the motion of the comet can be written as
(3)where r is the heliocentric position vector of the comet, k is the Gauss gravitational constant, and c the velocity of light. I formulate the equation of motion in an equatorial heliocentric frame where the variables are the cartesian coordinates of the position of the comet. The equations of the motion of the comet can be written as 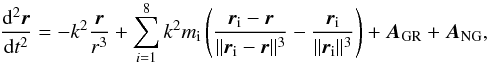 (4)where mi are the planet masses and ri the heliocentric position vector of the ith planet.
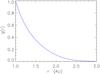 |
Fig. 1 g(r) as a function of the heliocentric distance r. This figure is generated using the Eq. (2). |
Optimal initial conditions deduced by fitting the astrometrical measurements of 67P.
Equation (4)can be reduced to a system of six first-order differential equations as 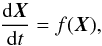 (5)where the components X1, X2, and X3 represent the components x, y, and z of the heliocentric position vector r of the comet. The components X4, X5, and X6 represent the components vx, vy, and vz of the velocity vector
  of the comet. The integrations of this system are performed using the 15th order RADAU integator (Everhart 1974).
2.2. Monte Carlo method to clone the comet
By fitting the astrometrical measurements of the comet, it is possible to obtain the orbital elements. According to the least square method and because of the randomly Gaussian errors of the observations, it is possible to determine the errors (see Table 1) of the orbital elements (or the cartesian coordinates by changing reference frame) and the non-gravitational parameters.
The chaotic behaviour of the comet is computed by considering several orbits with small variations of their initial conditions. The small variations are chosen randomly as  (6)where Xi are the initial conditions of the clone of the comet, Xi0 are the optimal initial conditions of the comet determined by fitting the astrometrical measurements, σXi0 are the errors on Xi0, and ϵi is a random number chosen in the normal distribution of mean 0 and variance 1 (because of the presumed Gaussian nature of the errors). I take care that the chosen values correctly describe the observations by rejecting the set of initial conditions with a rms that is too large (typically larger than 2.5′′ for the orbit considering NGF and 3′′ without NGF; above this limit many observations are not described accurately by the dynamical model). As a comparison, the distributions of the residuals corresponding to the nominal solution are represented in Fig. 2. The mean value of this residual is 0.11′′ and the rms is 0.9′′. The initial conditions and their errors are presented in Table 1. They come from the IMCCE database1. These initial conditions are adjusted to 3730 observations from July 3, 1995, to November 15, 2014.
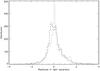 |
Fig. 2 Distribution of the optimal residual in right ascension (dotted line) and declination (dashed line). |
3. Results
The orbits are backward integrated first with 10 000 steps of 10 days, which is almost 275 years, and then with 10 000 steps of 1 year, which corresponds to 10 000 years. For each time period, 2000 clones were integrated (1000 with non-gravitational forces and 1000 without). For each set of 1000 orbits, the mean value (plain lines) and the standard deviation (dashed lines) of the six orbital elements are computed and presented in Figs. 4 and 5 . According to the definition of the normal law, we note that 68% of the orbits (which corresponds to the statistic of being between the mean, plus or minus the standard deviation) lie between the dashed lines of the figures. The six orbital elements considered are the semi-major axis a, the eccentricity e, the orbit inclination i, the argument of the perihelion ω, the longitude of the ascending node Ω, and the perihelion distance qh.
The comet is known to experience close encounter with Jupiter. The two last closest encounters happen on February 4, 1959 (closest distance 0.05 AU), and October 2, 1923 (closest distance 0.92 AU). The 1959 close approach drastically modified the orbit of the comet. The semi-major axis was reduced from about 4.3 AU to 3.5 AU and its perihelion distance was reduced from about 2.7 AU to 1.3 AU (see Figs. 4a and b). The semi-major axis and the perihelion distance were not the only parameters affected by this event. Indeed, the orbit became more eccentric (e increased form 0.38 to 0.63) and closer to the ecliptic plane (i decreased from 41° to 28°). Every close encounter of the comet with Jupiter made the calculation of past orbits less and less precise. Indeed, each close approach tends to increase the chaoticity of the orbit. The chaoticity of the motion of the comet was investigated using the FLI. The FLI is defined as (Fouchard et al. 2002; Froeschlé et al. 1997) 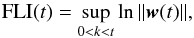 (7)where the vector w(t) is the solution of the variational equation
  of the system (Eq. (5)). Figure 3 shows the evolution of the FLI as a function of time. Because the FLI increases exponentially in a log-log scale, we can conclude that the system is chaotic (Fouchard et al. 2002; Froeschlé et al. 1997).
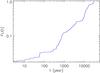 |
Fig. 3 Evolution the fast Lyapunov indicator as a function of time. |
For a date anterior to the close encounter with Jupiter in 1923, the two sets (with and without NGF) of 1000 orbits are diverging relatively to each other. Indeed, before 1923, the orbital element can take values in a large range (see Figs. 4 and 5) because, for a time anterior to the date of the 1923 close encounter, the system was chaotic.
Nevertheless, it is possible to study the trends of the orbital elements in the past. We note that in the past the orbit was surely a bit more circular (see Figs. 4 and 5c) than now with an eccentricity around 0.4. We can note a large variation of the inclination during the period [− 1000;1960] years. The inclination increased from about 25° to about 42° (see Fig. 5d). According to Figs. 5a and b, we see that the comet was probably orbiting under the control of Jupiter as noted by Krolikowska (2003) with a perihelion distance of about 3.5 au and a semi-major axis varying from 10 au at 10 000 years ago to 4.5 au prior to the close encounter with Jupiter in 1923. We can note that the NGF does not have a big influence on the evolution of the orbital elements of the comet except for the dispersion of the semi-major axis (see Fig. 5a).
According to Figs. 4e, f, 5e, and f, the plane of the orbit and the orbit itself are probably slowly precessing.
Finally, according to Figs. 4b and 5b, we see that before the close encounter with Jupiter in 1959, the perihelion distance was farther from the sun than it is today. Indeed, at least 84% of the calculated orbits (orbit beyond  ) lie beyond 2 AU where the activity of the comet is low (see Fig. 1). So the nucleus surface may be young and not much altered by outgassing processes.
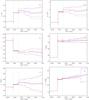 |
Fig. 4 Variation of the orbital elements (a, q, e, i, ω, and Ω) over 275 years. The plain line is the mean value of the element over 1000 orbits and the dashed lines represent the standard deviation. In blue are the orbits with NGF and in red the orbits without NGF. The green dashed lines represent the last two close encounters with Jupiter. |
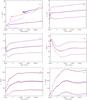 |
Fig. 5 Variation of the orbital elements (a, q, e, i, ω, and Ω) over 10 000 years. The plain line is the mean value of the element over 1000 orbits and the dashed lines represent the standard deviation. In blue are the orbits with NGF and in red the orbits without NGF. |
4. Conclusion
This study shows the mean evolution and the dispersion of the different orbital elements of the comet 67P/Churyumov-Gerasimenko, target of the ESA/Rosetta mission. This is done for two sets of 1000 clone orbits considering or not the non-gravitational forces for two time scales: 275 years and 10 000 years. This work is useful for interpreting the observations of the Rosetta spaceprobe. Indeed, the main conclusions of this study are the following:
-
The close encounter with Jupiter on February
 , 1959, drastically modified the orbital elements of the comet.
 -
The motion of the comet was chaotic in the past before the 1923 close encounter with Jupiter.
-
According to the mean trend of qh and for a date anterior to the 1959 close encounter with Jupiter, the comet was orbiting farther from the Sun (qh> 2 AU) where the nucleus activity (outgassing) was lower than now. Thus, the material at the surface of the nucleus has to be relatively young.
-
The variations of the mean orbital elements are not really sensitive to the effects of the non-gravitational forces except for the distribution of the clone orbit for the semi-major axis.
Acknowledgments
It is a great pleasure to thank Marc Fouchard and the anonymous referees for very useful comments and advice. I thank also Jérémie Vaubaillon and Frédéric Pierret for their careful proofreading. Finally, I want to thank Jacques Laskar, Philippe Robutel and Mickael Gastinau for their advice concerning the chaos indicator and for providing me with a long-term solution of the planetary theory INPOP. I am supported by a Europeen Space Agency (ESA) research fellowship at the Europeen Space Astronomy Center (ESAC), in Madrid, Spain.
References
- Abe, Y., Ohtani, E., Okuchi, T., Righter, K., & Drake, M. 2000, in Water in the Early Earth, eds. R. M. Canup, K. Righter, et al., 413 [Google Scholar]
- Beutler, G. 2005, Methods of celestial mechanics, Vol. I: Physical, mathematical, and numerical principles (Berlin: Springer) [Google Scholar]
- Everhart, E. 1974, Celest. Mech., 10, 35 [NASA ADS] [CrossRef] [Google Scholar]
- Fienga, A., Manche, H., Laskar, J., Gastineau, M., & Verma, A. 2014, ArXiv e-prints [arXiv:1405.0484] [Google Scholar]
- Fouchard, M., Lega, E., Froeschlé, C., & Froeschlé, C. 2002, Celest. Mech. Dyn. Astron., 83, 205 [NASA ADS] [CrossRef] [Google Scholar]
- Froeschlé, C., Lega, E., & Gonczi, R. 1997, Celest. Mech. Dyn. Astron., 67, 41 [CrossRef] [Google Scholar]
- Groussin, O., Hahn, G., Lamy, P. L., Gonczi, R., & Valsecchi, G. B. 2007, MNRAS, 376, 1399 [NASA ADS] [CrossRef] [Google Scholar]
- Krolikowska, M. 2003, Acta Astron., 53, 195 [NASA ADS] [Google Scholar]
- Maquet, L. 2012, Ph.D. Thesis, IMCCE/Observatoire de Paris [Google Scholar]
- Marsden, B. G., Sekanina, Z., & Yeomans, D. K. 1973, AJ, 78, 211 [NASA ADS] [CrossRef] [Google Scholar]
- Morbidelli, A., Chambers, J., Lunine, J. I., et al. 2000, Meteor. Planet. Sci., 35, 1309 [Google Scholar]
- Tubiana, C., Snodgrass, C., Bertini, I., et al. 2015, A&A, 573, A62 [NASA ADS] [CrossRef] [EDP Sciences] [Google Scholar]
All Tables
Optimal initial conditions deduced by fitting the astrometrical measurements of 67P.
All Figures
|
Fig. 1 g(r) as a function of the heliocentric distance r. This figure is generated using the Eq. (2). |
| In the text | |
|
Fig. 2 Distribution of the optimal residual in right ascension (dotted line) and declination (dashed line). |
| In the text | |
|
Fig. 3 Evolution the fast Lyapunov indicator as a function of time. |
| In the text | |
|
Fig. 4 Variation of the orbital elements (a, q, e, i, ω, and Ω) over 275 years. The plain line is the mean value of the element over 1000 orbits and the dashed lines represent the standard deviation. In blue are the orbits with NGF and in red the orbits without NGF. The green dashed lines represent the last two close encounters with Jupiter. |
| In the text | |
|
Fig. 5 Variation of the orbital elements (a, q, e, i, ω, and Ω) over 10 000 years. The plain line is the mean value of the element over 1000 orbits and the dashed lines represent the standard deviation. In blue are the orbits with NGF and in red the orbits without NGF. |
| In the text | |
Current usage metrics show cumulative count of Article Views (full-text article views including HTML views, PDF and ePub downloads, according to the available data) and Abstracts Views on Vision4Press platform.
Data correspond to usage on the plateform after 2015. The current usage metrics is available 48-96 hours after online publication and is updated daily on week days.
Initial download of the metrics may take a while.