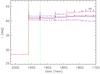
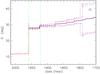
Fig. 4
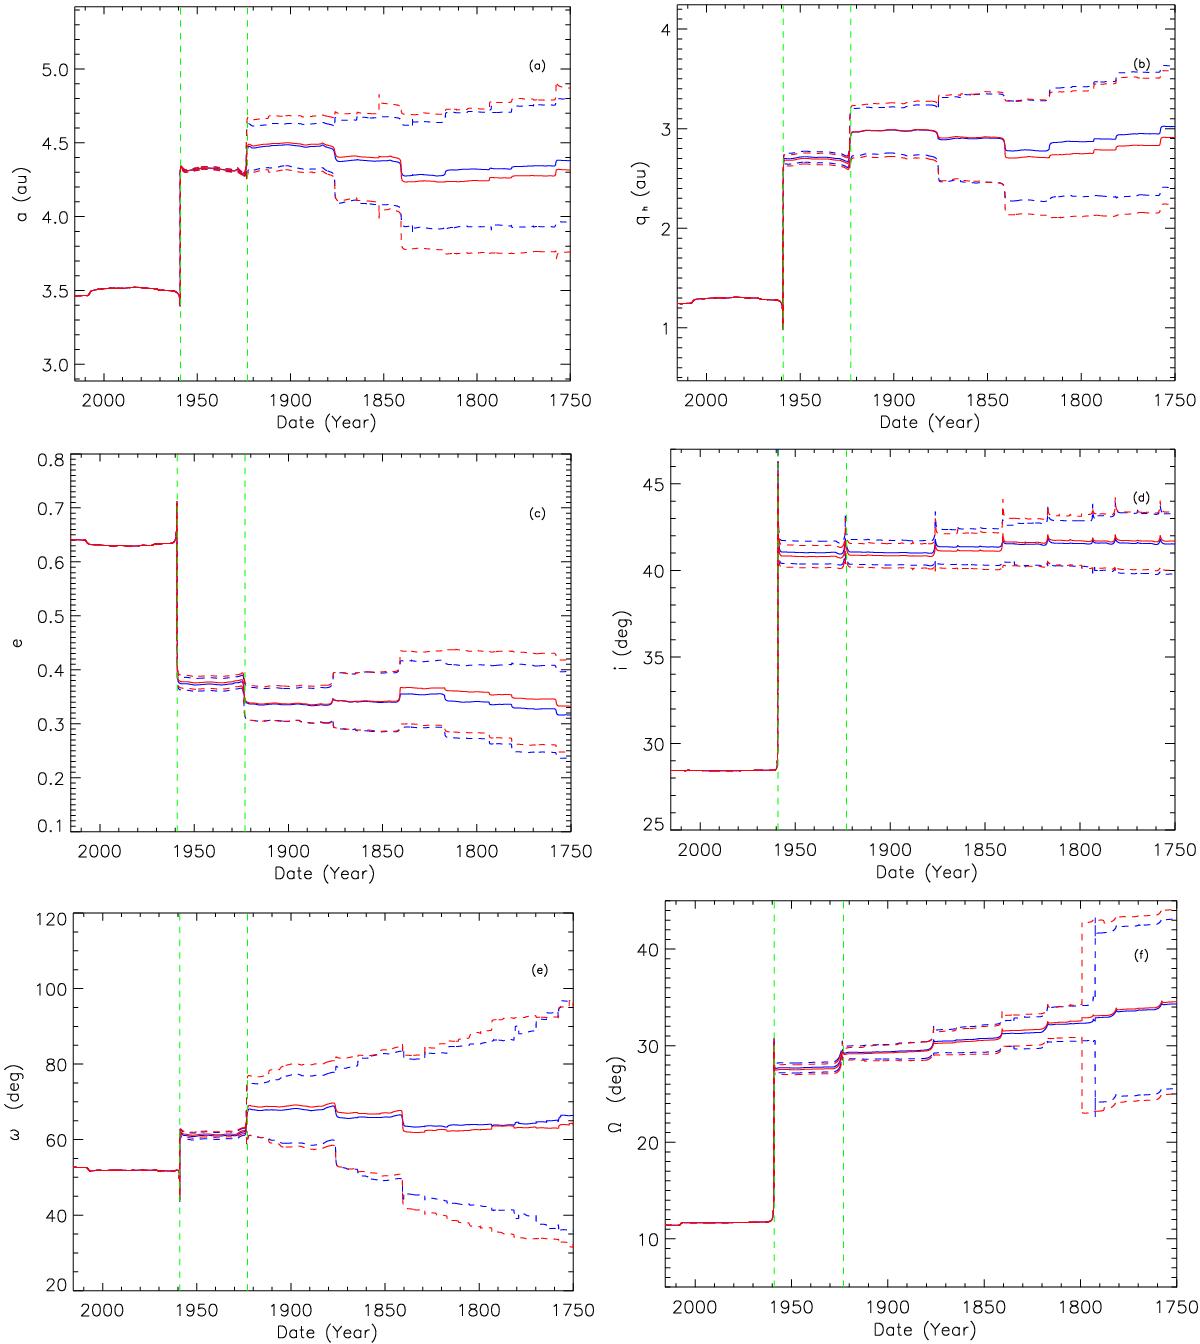
Variation of the orbital elements (a, q, e, i, ω, and Ω) over 275 years. The plain line is the mean value of the element over 1000 orbits and the dashed lines represent the standard deviation. In blue are the orbits with NGF and in red the orbits without NGF. The green dashed lines represent the last two close encounters with Jupiter.

Current usage metrics show cumulative count of Article Views (full-text article views including HTML views, PDF and ePub downloads, according to the available data) and Abstracts Views on Vision4Press platform.
Data correspond to usage on the plateform after 2015. The current usage metrics is available 48-96 hours after online publication and is updated daily on week days.
Initial download of the metrics may take a while.