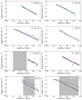
Fig. 6
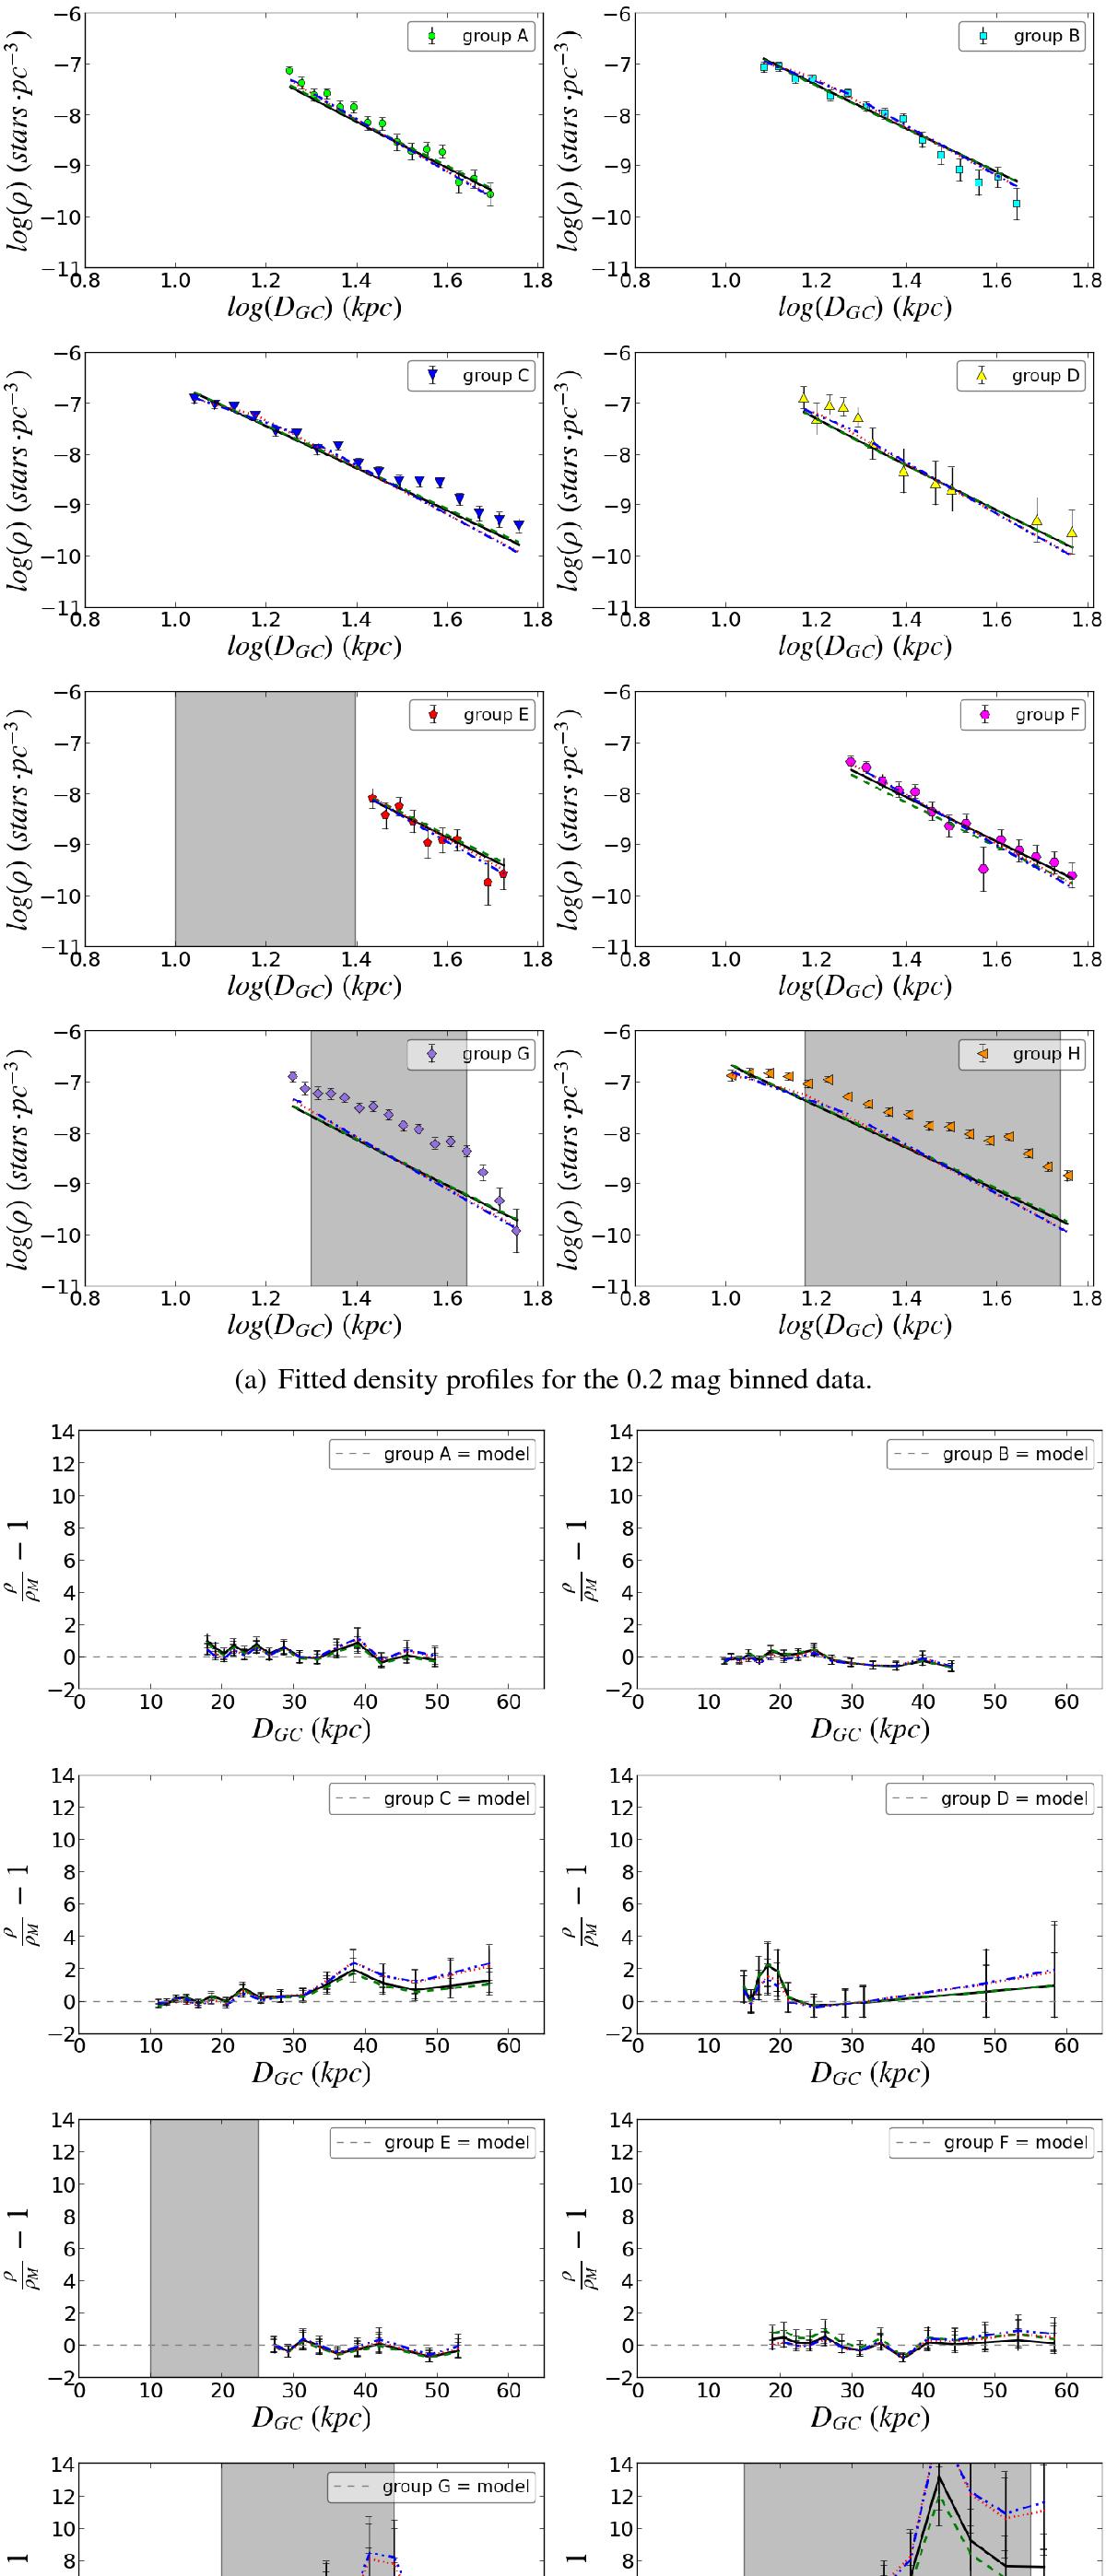
Left panels: density profiles in decimal logarithmic scale and the best fit models from Table 2 (fitted to masked 0.2 binned data). Right panels: residuals between the data and the best fit models from panel 6a. The different lines represent the axisymmetric (black solid line), the triaxial (green dashed line), the broken power law with varying power index (red dotted line) and the broken power law with varying power index and oblateness (blue dashed-dotted-dotted line) models. The grey areas denote data that have been masked from the fitting to account for the presence of substructure.
Current usage metrics show cumulative count of Article Views (full-text article views including HTML views, PDF and ePub downloads, according to the available data) and Abstracts Views on Vision4Press platform.
Data correspond to usage on the plateform after 2015. The current usage metrics is available 48-96 hours after online publication and is updated daily on week days.
Initial download of the metrics may take a while.