Fig. 2
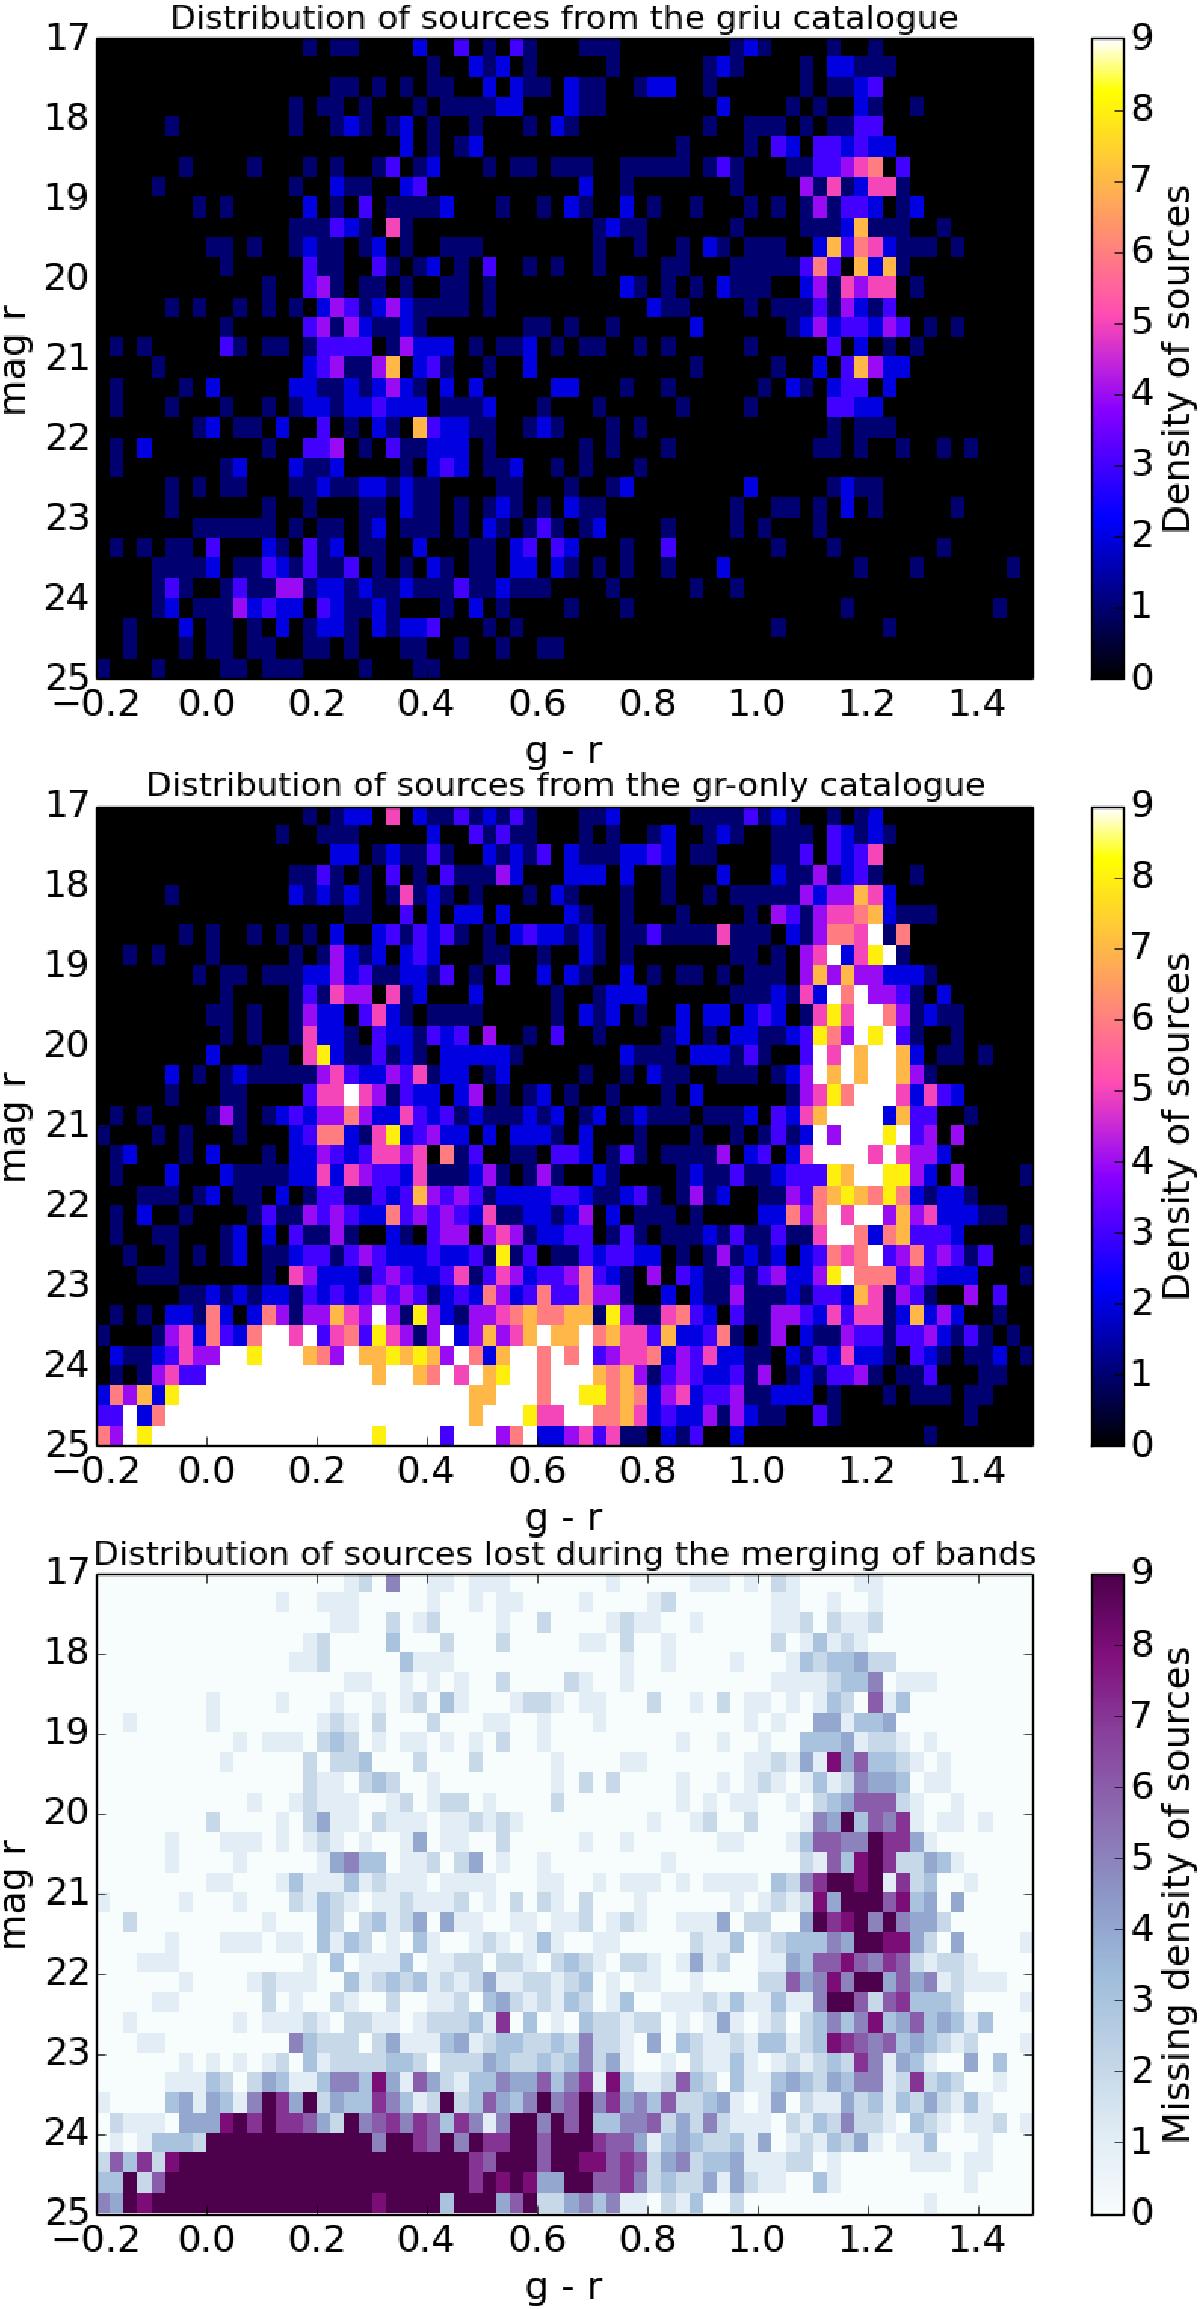
Hess diagrams showing the number of sources per colour−magnitude bin in the ugri catalogue (top), in the gr catalogue (centre) and the difference between both (bottom) for field A1033. Most of the sources lost when combining the catalogues correspond to faint magnitudes, because the i and the U observations are shallower. The effect is the removal of most of the faint galaxies (located in the −0.2 <g − r< 0.7 and r> 23 region in the central panel), most of the faintest disk M dwarves (1.1 <g − r< 1.3) and a number of faint objects (in the i or the U bands) scattered throughout the (g − r,r) diagram.
Current usage metrics show cumulative count of Article Views (full-text article views including HTML views, PDF and ePub downloads, according to the available data) and Abstracts Views on Vision4Press platform.
Data correspond to usage on the plateform after 2015. The current usage metrics is available 48-96 hours after online publication and is updated daily on week days.
Initial download of the metrics may take a while.