Fig. 1
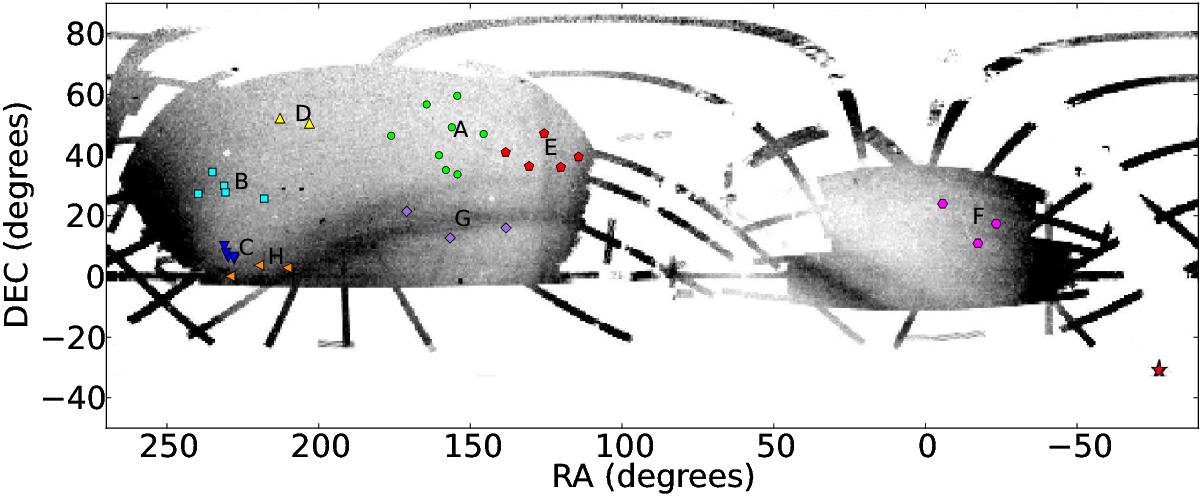
Equatorial map showing the position of all the fields used in this work. The different colours and symbols indicate how the fields have been grouped to calculate the different density profiles. The background image is the SDSS-DR8 map from Koposov et al. (2012), which shows the footprint of the Sagittarius stream and the location of the Sagittarius dwarf galaxy. When grouping the fields, we have also taken into account the presence of this stream, the Triangulum-Andromeda overdensity, and the anticentre substructures (ACS, EBS, and Monoceros), in trying to combine their effect in certain profiles and avoid it in others.
Current usage metrics show cumulative count of Article Views (full-text article views including HTML views, PDF and ePub downloads, according to the available data) and Abstracts Views on Vision4Press platform.
Data correspond to usage on the plateform after 2015. The current usage metrics is available 48-96 hours after online publication and is updated daily on week days.
Initial download of the metrics may take a while.