| Issue |
A&A
Volume 579, July 2015
|
|
|---|---|---|
| Article Number | A27 | |
| Number of page(s) | 10 | |
| Section | Extragalactic astronomy | |
| DOI | https://doi.org/10.1051/0004-6361/201425416 | |
| Published online | 22 June 2015 | |
The peculiar radio galaxy 4C 35.06: a case for recurrent AGN activity?
1 University of Groningen, Kapteyn
Astronomical Institute, Landleven
12, 9747
AD Groningen, The Netherlands
e-mail: This email address is being protected from spambots. You need JavaScript enabled to view it.
2 ASTRON, the Netherlands Institute for
Radio Astronomy, Postbus
2, 7990 AA
Dwingeloo, The
Netherlands
e-mail: This email address is being protected from spambots. You need JavaScript enabled to view it.
; This email address is being protected from spambots. You need JavaScript enabled to view it.
3 INAF–Osservatorio Astronomico di Cagliari, via della Scienza
5, 09047
Selargius (Cagliari), Italy
4 Harvard-Smithsonian Center for
Astrophysics, 60 Garden Street, Cambridge, MA
02138,
USA
5 Department of Physics and Astronomy,
The Open University, Milton
Keynes
MK7 6AA,
UK
6 RAL Space, The Rutherford Appleton
Laboratory, Chilton,
Didcot, Oxfordshire
OX11 0QX,
UK
7 Universität Hamburg,
Hamburger Sternwarte, Gojenbergsweg
112, 21029
Hamburg,
Germany
8 Toruń Centre for Astronomy, Faculty
of Physics, Astronomy and
Informatics, NCU, Grudziacka 5, 87-100
Toruń,
Poland
9 Obserwatorium Astronomiczne,
Uniwersytet Jagielloński, ul Orla 171, 30-244
Kraków,
Poland
10 SUPA, Institute for Astronomy,
Royal Observatory Edinburgh, Blackford Hill, Edinburgh
EH9 3HJ,
UK
11 LeidenObservatory, Leiden
University, PO Box
9513, 2333 RA
Leiden, The
Netherlands
12 Helmholtz-Zentrum Potsdam,
DeutschesGeoForschungsZentrum GFZ, Department 1: Geodesy and Remote Sensing,
Telegrafenberg,
A17, 14473
Potsdam,
Germany
13 Max-Planck-Institut für
Radioastronomie, Auf dem Hügel
69, 53121
Bonn,
Germany
14 CSIRO Australia Telescope National
Facility, PO Box 76, NSW 1710
Epping,
Australia
15 University of Twente,
Drienerlolaan 5,
7522 NB
Enschede, The
Netherlands
16 Leibniz-Institut für Astrophysik
Potsdam (AIP), An der Sternwarte
16, 14482
Potsdam,
Germany
17 Astrophysics, University of Oxford,
Denys Wilkinson Building, Keble
Road, Oxford
OX1 3RH,
UK
18 School of Physics and Astronomy,
University of Southampton, Southampton, SO17
1BJ, UK
19 Research School of Astronomy and
Astrophysics, Australian National University, Mt Stromlo Obs., via Cotter Road, ACT
2611
Weston,
Australia
20 Anton Pannekoek Institute,
University of Amsterdam, Postbus
94249, 1090 GE
Amsterdam, The
Netherlands
21 Max Planck Institute for
Astrophysics, Karl Schwarzschild
Str. 1, 85741
Garching,
Germany
22 SmarterVision BV, Oostersingel 5,
9401 JX
Assen, The
Netherlands
23 Thüringer Landessternwarte,
Sternwarte 5, 07778
Tautenburg,
Germany
24 Department of Astrophysics/IMAPP,
Radboud University Nijmegen, PO Box
9010, 6500 GL
Nijmegen, The
Netherlands
25 LPC2E–Université d’Orléans/CNRS,
45071
Orléans Cedex 2,
France
26 Station de Radioastronomie de
Nancay, Observatoire de Paris – CNRS/INSU, USR 704 – Univ. Orléans, OSUC, route de
Souesmes, 18330
Nançay,
France
27 National Radio Astronomy
Observatory, 520 Edgemont
Road, Charlottesville, VA
22903-2475,
USA
28 Astronomisches Institut der
Ruhr-Universität Bochum, Universitaetsstrasse 150, 44780
Bochum,
Germany
29 Astro Space Center of the Lebedev
Physical Institute, Profsoyuznaya
str. 84/32, 117997
Moscow,
Russia
30 Jodrell Bank Center for
Astrophysics, School of Physics and Astronomy, The University of Manchester,
Manchester
M13 9PL,
UK
31 National Astronomical Observatory
of Japan, 2 Chome-21-1 Osawa,
Mitaka, Tokyo,
Japan
32 Sodankylä Geophysical Observatory,
University of Oulu, Tähteläntie
62, 99600
Sodankylä,
Finland
33 STFC Rutherford Appleton
Laboratory, Harwell Science and
Innovation Campus, Didcot
OX11 0QX,
UK
34 University of Groningen,
Center for Information Technology
(CIT), Nettelbosje 1, 9747
AJ
Groningen, The
Netherlands
35 Centre de Recherche Astrophysique
de Lyon, Observatoire de Lyon, 9
Av. Charles André, 69561
Saint-Genis Laval Cedex,
France
36 Fakultät für Physik, Universität
Bielefeld, Postfach
100131, 33501
Bielefeld,
Germany
37 Department of Physics and
Electronics, Rhodes University, PO
Box 94, 6140
Grahamstown, South
Africa
38 SKA South Africa, 3rd Floor, The
Park, Park Road, 7405
Pinelands, South
Africa
39 LESIA, UMR CNRS 8109, Observatoire
de Paris, 92195
Meudon,
France
40 IRA–INAF, via P. Gobetti 101,
40129
Bologna,
Italy
41 Laboratoire Lagrange, UMR 7293,
Université de Nice Sophia-Antipolis, CNRS, Observatoire de la Côte d’Azur,
06300
Nice,
France
Received:
26
November
2014
Accepted:
16
April
2015
Abstract
Using observations obtained with the LOw Fequency ARray (LOFAR), the Westerbork Synthesis Radio Telescope (WSRT) and archival Very Large Array (VLA) data, we have traced the radio emission to large scales in the complex source 4C 35.06 located in the core of the galaxy cluster Abell 407. At higher spatial resolution (~ 4″), the source was known to have two inner radio lobes spanning 31 kpc and a diffuse, low-brightness extension running parallel to them, offset by about 11 kpc (in projection). At 62 MHz, we detect the radio emission of this structure extending out to 210 kpc. At 1.4 GHz and intermediate spatial resolution (~ 30″), the structure appears to have a helical morphology. We have derived the characteristics of the radio spectral index across the source. We show that the source morphology is most likely the result of at least two episodes of AGN activity separated by a dormant period of around 35 Myr. The outermost regions of radio emission have a steep spectral index (α< − 1), indicative of old plasma. We connect the spectral index properties of the resolved source structure with the integrated fluxdensity spectral index of 4C 35.06 and suggest an explanation for its unusual integrated flux density spectral shape (a moderately steep power law with no discernible spectral break), possibly providing a proxy for future studies of more distant radio sources through inferring their detailed spectral index properties and activity history from their integrated spectral indices. The AGN is hosted by one of the galaxies located in the cluster core of Abell 407. We propose that it is intermittently active as it moves in the dense environment in the cluster core. In this scenario, the AGN turned on sometime in the past, and has produced the helical pattern of emission, possibly a sign of jet precession/merger during that episode of activity. Using LOFAR, we can trace the relic plasma from that episode of activity out to greater distances from the core than ever before. Using the the WSRT, we detect H I in absorption against the center of the radio source. The absorption profile is relatively broad (FWHM of 288 kms-1), similar to what is found in other clusters. The derived column density is NHI ~ 4 × 1020 cm-2 for a Tspin = 100 K. This detection supports the connection – already suggested for other restarted radio sources – between the presence of cold gas and restarting activity. The cold gas appears to be dominated by a blue-shifted component although the broad H I profile could also include gas with different kinematics. Understanding the duty cycle of the radio emission as well as the triggering mechanism for starting (or restarting) the radio-loud activity can provide important constraints to quantify the impact of AGN feedback on galaxy evolution. The study of these mechanisms at low frequencies using morphological and spectral information promises to bring new important insights in this field.
Key words: radio continuum: galaxies / galaxies: active / radio lines: galaxies / galaxies: individual: 4C 35.06
© ESO, 2015
1. Introduction
For some time now it has been recognized that the active phase of radio-loud active galactic nuclei (AGN) can be recurrent (see Saikia & Jamrozy 2009, for a review). Therefore, this activity can have a repeated impact on the AGN host galaxy and its environment, starting from the initial phase of the radio source’s life (O’Dea 2002) on to its later stages (McNamara et al. 2000). The morphology of a (recurrent) radio source can vary significantly (see e.g. Schoenmakers et al. 2000; Murgia et al. 2011). Therefore, only a combination of radio morphology and radio spectral index1 analyses can reliably tell us whether a radio source had recurring activity, thereby affecting its host galaxy more than once. A typical radio-loud AGN in its active phase (which can last up to several 107 yr) is characterized by the presence of a radio core and extended lobes with or without visible jets. When the AGN shuts down, emission from the core disappears for the duration of the “off” phase. The large scale radio lobes might still be replenished with particles if the information of the core shutdown has not had enough time to propagate out. However, once the supply of energetic particles coming from the core stops, the lobe plasma starts to age producing a so-called relic structure and the radio source enters a fading phase in its life-cycle. It is possible that during this time the AGN re-activates, in which case we can again observe an active radio core (possibly with new jets/lobes expanding outward into the ISM/IGM) co-existing with a fading radio relic on larger scales.
The energy loss mechanism for relic radio plasma is mostly through synchrotron radiation and inverse Compton (IC) scattering off of cosmic microwave (CMB) photons (with possible adiabatic expansion related losses). Its observational signature is a steepening of the radio spectrum of the emission regions (synchrotron radiation and IC losses deplete high-energy particles faster than low-energy ones), making them relatively brighter at low frequencies (Kardashev 1962). Thus, the relic radio emission is typically faint and detecting it requires low-frequency observations with high sensitivity.
This work is part of a larger study where we investigate radio sources with restarted activity expanding our studies to low frequencies, using the LOw Frequency ARray (LOFAR, Van Haarlem et al. 2013). Our aim is to describe in more detail their activity history (duty cycle). We also benefit from the advantage of having sufficient spatial resolution to be able to study resolved source structure at low frequencies. We relate our results to the integrated flux density spectral properties of these sources in an attempt to extrapolate our results to the high redshift source population (in which case we would have poorer spatial resolution).
In this work, we investigate the complex radio morphology of 4C 35.06 (B2 0258+35B; Bondi et al. 1993). Liuzzo et al. (2010) did a study of UGC 2489 using the Very Long Baseline Array (VLBA) and they detected an extended source on a milli arcsec scale with a core flux density of ~ 2.6 mJy, stating that the VLBA detection coincides with one of the cores of the cD galaxy UGC 2489 (Fig. 1). UGC 2489 represents the core of the Abell 407 galaxy cluster (Schneider & Gunn 1982, see Fig. 1). The radio luminosity of 4C 35.06 is L1.4 GHz = 2.5 × 1024 W Hz-1. This value is consistent according to Best & Heckman (2012) with being a low excitation radio galaxy (LERG) as confirmed by the low-resolution optical spectra of the host galaxy (Schneider & Gunn 1982; Crawford et al. 1999) showing no emission lines.
In the VLA maps we can see two inner radio lobes spanning 31 kpc and a diffuse, low-brightness extension running parallel to them, oriented southeast to northwest (see Fig. 1). The puzzling structure hints at the possibility of multiple AGN activity episodes combined with motion of the host core within the cD galaxy, making this source particularly interesting for studying AGN recurrent activity and the triggering of the active phases.
We made use of images available in the Jansky Very Large Array (VLA) archive. Furthermore, we took advantage of the fact that this source was included in one of the fields observed by the LOFAR during commissioning tests.
In addition, we also present new Westerbork Synthesis Radio Telescope (WSRT) observations obtained to investigate the presence of cold gas (H I) in this object. As mentioned above, one of the open questions is the relation between the gas and the fueling of multiple phases of activity. Atomic neutral hydrogen can, in principle, provide such fuel.
The paper is organized in the following way. Section 2 discusses the data reduction procedure, while in Sect. 3 we present the LOFAR image and quantities derived from it. We discuss the implications of our results, in combination with results of previous studies in Sect. 4, and we conclude with a summary in Sect. 5.
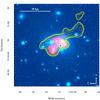 |
Fig. 1 Optical image of UGC 2489 taken from the Sloan Digital Sky Survey (SDSS, Aihara et al. 2011) showing its multi-component core structure. The red intensity overlay shows a 4885 MHz VLA archival image. In yellow we over-plot contours from a 1415 MHz VLA archival image. Contours are log scaled, there are 10 contour levels going from 4σ to 500σ. Details about the VLA images can be found in Table 1. The stellar halo around the cores is roughly 40 kpc in extent. The position of the core hosting the AGN is shown with a black cross. |
Throughout this paper we assume a flat Λ cold dark matter (ΛCDM) cosmology with H0 = 73 km s-1 Mpc-1, ΩΛ = 0.73 and Ωm = 0.27. At the distance of 4C 35.06, using z = 0.046276 (corrected to the reference frame defined by the CMB), this results in 1′′ = 0.872 kpc (Wright 2006).
Summary of the images of 4C 35.06 used in this work.
2. Data available, new observations and data reduction
2.1. LOFAR
The observations using LOFAR were carried out in the night of October 8, 2011 using the low band antennas (LBA) at 62 MHz centered on B2 0258+35A observed as part of the LOFAR commissioning efforts. 4C 35.06 is located about half a degree to the north from the phase center. Table 2 summarizes the observational configuration.
LOFAR observational configuration.
The data were flagged to remove radio frequency interference (RFI) using the AO flagger package (Offringa et al. 2012) and averaged to a frequency resolution of 192 kHz per channel and a time resolution of 10 seconds per sample. Calibration was performed using the Black Board Selfcal (BBS) package using the complete bandwidth. The set up of the observations did not include observations of a flux calibrator, therefore the initial calibration model was derived from a VLSS2 image following the procedure described in Van Weeren et al. (2012) and De Gasperin et al. (2012). The image from which the initial model was derived had a size of 8° × 8° to encompass the full width at half maximum (FWHM) of the LOFAR station (primary) beam, and to ensure that any brighter sources beyond the FWHM are included in the model. The model components were specified as having a spectral index of α = −0.8. During the calibration, we have solved for the complex valued station gains and for the differential total electron content (dTEC) over the full bandwidth.
Imaging was done using the Common Astronomy Software Applications package (CASA; McMullin et al. 2007), using multi-scale clean (Cornwell 2008). We imaged by selecting the data in UV distance below 20 km, limiting ourselves to stations having satisfactory calibration solutions, avoiding as much as possible calibration errors induced by the ionosphere, while retaining enough spatial resolution. We weighted the baselines used for imaging using Briggs weights with the robust parameter set to −0.1 (Briggs 1995). We have used multi-frequency synthesis (assuming no frequency dependence of the sky model) imaging over the entire bandwidth.
After obtaining the initial image, we have performed a correction for the primary (station) beam shape to ensure a correct flux scale over the FoV. The correction was applied by deriving the average LOFAR station beam, using CASA to image (with the same settings as were applied in the imaging) a grid of BBS simulated point sources covering the LOFAR FoV. The recovered flux densities were used to derive the primary beam which we use to correct the image.
Before the final imaging, three self-calibration runs were performed by iterating over the procedure described above. We have reached an image noise of about 35 mJy beam-1 measured away from bright sources. The size of the restoring beam is 51″ × 43″.
We have checked the flux scale across the final image, by comparing the flux densities of sources in our LOFAR image with their values in existing surveys. Compact sources with S/N> 10 were extracted using the PyBDSM package (Ramanujam 2007) and their flux density at 62 MHz compared with the extrapolation from the VLSS, WENSS3 and NVSS4 catalogs. The derived LOFAR flux densities were estimated to be accurate to ~ 10% level.
A check of the positional accuracy of the LOFAR image was performed by plotting the differences between positions of the sources extracted from the LOFAR image and matched sources from the NVSS survey. Again, we used PyBDSM to extract point sources from the LOFAR image. Positional differences for source matches between the WENSS and NVSS catalogs were used as control. On average, the derived position offset for point sources in the vicinity of 4C 35.06 extracted from the LOFAR image and the corresponding NVSS catalog sources is less than 5′′ without any obvious systematics. Thus, for the purpose of this study, we concluded that there is no position offset in the LOFAR image.
2.2. H I – 21 cm and continuum from the WSRT
WSRT observations to search for H I in 4C 35.06 were performed at three epochs (2013 April 8 and 11, June 12) for 8, 7 and 6 h respectively. The observing band was centered on 1356.8 MHz, the frequency of H I for z = 0.0464, the redshift of 4C 35.06. The total bandwidth was 20 MHz, corresponding to a velocity range of ~ 4422kms-1 and was covered with 1024 channels (dual polarization). In order to increase the signal-to-noise ratio, four channels were binned resulting in a spectral resolution of 17 kms-1 in the output data cube. The data reduction was performed using the MIRIAD package (Sault et al. 1995). After flagging, bandpass and phase calibration were performed. The continuum emission was subtracted, using the task uvlin, by making a second-order polynomial fit to the line-free channels of each visibility record.
Cubes with different weighting were obtained. For an intermediate weighting (Briggs with the robust parameter set to 0.4), the final rms noise was 0.2 mJy beam-1 chan-1 for a velocity resolution of 15 kms-1 and spatial resolution of 34″ × 14″. In addition to the line cube, a continuum image was obtained using the line-free channels. The peak of the continuum emission was 221 mJy and the rms noise was 0.18 mJy beam-1.
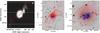 |
Fig. 2 Left: WSRT 1360 MHz continuum image of 4C 35.06. Overlaid in red are contours taken from the same image, with levels (− 5,15,150)σ, while plotted in black are 4885 MHz VLA contours of the central region with contour levels of (− 5,50,100,200,350)σ. The WSRT beam is shown in the lower left corner. Middle: the 4C 35.06 radio source as seen by LOFAR at 62 MHz, represented by red contours (33 levels spanning (− 3,183)σ) over an inverted grayscale SDSS image of the central region of the Abell 407 cluster. The peak flux density in this map is 9.1 Jy. Regions in the LOFAR map are labeled A through E. Overlaid in blue are the VLA 4885 MHz image contours. Right: LOFAR 62 MHz (red) and VLA 1415 MHz (blue) contours overlaid over an inverted grayscale SDSS image of the cluster core (UGC 2489). The location of the core hosting the AGN is indicated with a white star. Arrows show the extent and the location of the regions of interest in different images. The relevant beam sizes and noise levels of the images are given in Table 1. |
3. Results
3.1. Radio continuum structure from WSRT and LOFAR
Our LOFAR and WSRT images of 4C 35.06, as well as data derived from the archival VLA images are presented in Fig. 2. Looking at the morphology traced by the different images at different resolution, we can note several things.
Firstly, Fig. 2 indicates that the emission parallel to the inner radio lobes is connected to the more distant regions through a helical structure (best seen in the left panel of Fig. 2 as a bent tail of emission extending to the northwest from the central region, and then turning to the south; we note that there is also a similar almost symmetric extension to the southeast). The WSRT image has sufficiently high resolution to enable us to justify the claim that the helicity is real and not an artifact of the elongated beam. It has recently been imaged by Biju et al. (2014) using the Giant Metre Wave Radio Telescope (GMRT). Observations using LOFAR at a frequency of 150 MHz and higher resolution than described in this work also show the helical substructure (Marisa Brienza, private communication). The helicity might indicate precession in the radio jet which has deposited the plasma, triggered by accretion disk instabilities (Kunert-Bajraszewska et al. 2010) or maybe a possible sign of a past black hole merger of two cores in UGC 2489.
The zoom-in of the central region of 4C 35.06 in the LOFAR image (labeled C) is shown in the right panel of Fig. 2 along with the same region as observed by the VLA at higher frequencies.
The source region labeled E is noticeable as a barely visible surface brightness enhancement in a VLSS image of 4C 35.06, and it is detected at a 2σ level in a VLA image by Gregorini et al. (1988). It is now unambiguously detected in the LOFAR image. Its projected distance from the central region (C) is ~210 kpc.
The region labeled A was previously detected by the VLSS (blended with the rest of the source) and partially by the WENSS, however our LOFAR map detects it with better resolution and allows us to clearly morphologically separate it from other regions of 4C 35.06.
The second interesting result is that, as shown in the right panel of Fig. 2, the peak flux of 4C 35.06 as seen by LOFAR is offset by 10′′ to the northwest with respect to the radio lobes seen in the VLA maps. This is a sufficiently large value to be considered a real effect and not a systematic offset (see Sect. 2.1). We interpret this difference between the peak flux density position and overall source position as intrinsic in the case of the extended source 4C 35.06 and indicative of its (spectral) properties.
3.2. H I gas
Atomic neutral hydrogen is detected against the central region of 4C 35.06. Figure 3 shows the H I profile (obtained from the combination of all WSRT data) extracted against the brighter (western) lobe of the central source (Fig. 1). The profile is obtained after Hanning smoothing and averaged over a region encompassing the western inner lobe. Given the limited spatial resolution of the WSRT H I observations, we can only say that H I is seen in from of the western lobe which, in fact, includes the radio core of the source.
The profile is complex, with a broader component with FWHM of 288 kms-1 centered at 13858 kms-1. The peak absorption is ~ 0.8 mJy which corresponds to a low optical depth of τ = 0.0036. From the parameters of the absorption we can estimate a column density of NHI ~ 4 × 1020 cm-2 for a Tspin = 100 K.
The H I profile is broader than that typically found in radio galaxies (Gereb et al. 2014), but resembles what is observed in some other clusters; we discuss this in more details in Sect. 4.1. While at uniform weighting the profile is dominated by two relatively narrow components, the broad component becomes more prominent at lower spatial resolution, suggesting that it belongs to a diffuse distribution of gas. However, given the low S/N of the detection this result will need to be verified with deeper observations. Compared to the systemic velocity of the host galaxy (14 120 kms-1), the peak of the H I profile appears blueshifted (see Fig. 3). However, the total width of the profile encompasses the range in velocity of the galaxies in the cluster core.
In addition to the absorption profile, there are at least three detections of H I emission in the WSRT FoV. All three have an optical counterpart in the SDSS. One of these detections is identified with UGC 2493, a (disturbed, possibly merging) galaxy pair having a redshift of z = 0.0437, which makes it a member of Abell 407 according to Chen et al. (1998). It is located at a radial distance of 210 kpc from the Abell 407 cluster core (UGC 2489). The other two detections are located at coordinates: J030219+354601 (H I disk associated with a edge on galaxy) and J030217+355533.
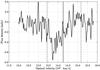 |
Fig. 3 H I absorption profile in 4C 35.06 (Hanning smoothing applied). The full vertical line indicates the systemic velocity of 4C 35.06 host galaxy, while the two vertical dashed lines show the highest and lowest velocity of the galaxies in the cluster core. |
3.3. Spectral analysis
Following the work of Murgia et al. (2011), we investigate the characteristics of the integrated spectrum of the source and then we turn to the spatially resolved analysis of the spectral index with the aim of getting a detailed handle on the past and present activity history.
We have compiled integrated flux density measurements of 4C 35.06, as shown in Table 3. The flux density values are taken from the literature, or measured from archival images, with comparable sensitivity to the extended emission. They are plotted in Fig. 4 along with our LOFAR flux value.
The best power-law fit to the integrated flux density data points has a spectral index of α = −1.01 ± 0.02. Although this is not an extremely steep spectral index, it is steeper than what is usually seen in the lobes of radio galaxies (α ~ −0.7 ± 0.1). The integrated spectrum does not show a spectral break.
This indicates that we average over regions of different ages having different intrinsic brightness. The sum of those spectra, each having spectral breaks at different frequencies, produces the remarkably straight integrated spectrum (see the discussion below for details).
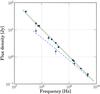 |
Fig. 4 Integrated flux density values for 4C 35.06 based on the data listed in Table 3 (circles) and its central region (stars). The LOFAR data points are in red. The green line represents a power law fit, while the blue dashed line gives the synchrotron aging model fit for region C. |
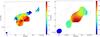 |
Fig. 5 Left: |


High-redshift radio sources that will be detected in future radio surveys will be (in most cases) unresolved. Therefore, it is important to benchmark the information obtained from the integrated flux density spectral studies against the one for the spatially resolved studies.
To expand on the different phases of radio-loud activity in this object, we used our LOFAR and WSRT observations, as well as archival VLA images to distinguish between the spectral index of the inner regions of 4C 35.06, and the outer regions of extended radio emission. The resulting spectral index images are shown in Fig. 5.
The maximum UV range of the LOFAR data set is 4 kλ, while that of the WSRT is 7 kλ × 13 kλ. The UV coverage within the range specified for the WSRT is uniform, while the LOFAR data set covers all of the spacings even though it has gaps due to the observation length. We have smoothed the WSRT image to highlight the shorter spacing’s. The VLA archival images were obtained from data sets with matching UV ranges and uniform UV coverage.
We see that the inner region where the core and the two brighter lobes are located shows a typical spectral index in the range of α ~ −0.6 to α ~ −0.8, indicative, as shown by the morphology of the inner double-lobed source, of an active region. However, there is a spectral steepening (α ~ −1.2) in the extended emission just to the northwest of the inner lobes (Fig. 5, left panel). This is the region of the source where we detect the peak flux density in our LOFAR map (see Fig. 2, right panel), in agreement with LOFAR being more sensitive to regions having steeper spectrum. Thus, this region could indeed represent a region of older radio plasma.
We used lower resolution images to derive a spectral index map for the larger scale regions of the source. The steepening seen at higher resolution in the structure running parallel to the inner brighter lobes, is also visible and continues out to larger scales. This can be seen in the right panel of Fig. 5. Going to the northwest, the spectral index remains at a value of around −1.2 up to ~ 50 kpc from the central region, while on the southeastern side it steepens already to about −1.4 quite close to the central region. This trend suggests that the outer, extended, regions of the source are composed of aged plasma.
We have fitted a synchrotron aging model including a period of activity and a period during which the AGN was switched off (KGJP; Komissarov & Gubanov 1994; Van Weeren et al. 2009) to the integrated flux density measurements at four different frequencies (images listed in Table 1) for the central region of the source (labeled C in Fig. 6). We have chosen the KGJP model (Komissarov-Gubanov prescription with a Jaffe & Perola 1973, loss term) since region C contains the radio emission of the currently active AGN as well as an older emission as is evident from the spectral index mapping. We have used an injection spectral index of α0 = −0.8. The equi-partition value for the magnetic field was calculated to be 5.34 μG (according to Miley 1980). Our best fit model gives a source age of ts = ton + toff = 1.5 + 10 Myr. Here, ts signifies the total source age, comprised of the time the source was active (ton) and the time elapsed since the AGN shutdown (toff). The model supports the observation that the central region is the youngest region of the source. We show the fits in Fig. 4.
We have also determined the spectral index of the outermost source region labeled E, as well as that of region labeled A by measuring the flux density of these regions as seen in the LOFAR image. We have adopted the measurement procedure outlined by Klein & Emerson (1981). The measurements were done by integrating the flux density over measurement areas in the regions A and E where the surface brightness was above the 3σ level in the LOFAR, VLSS, WENSS and NVSS images, as well as in our continuum WSRT image and thus calculating the spectral index. The derived values are given in Table 4.
We plot the data from Table 4 in Fig. 6 and fit a power-law to the data points for region A. The spectrum of region E is poorly constrained, but we note that it is ultra steep (α< −2). Region A has a flatter spectrum (α = −1.36 ± 0.09) in line with what we expect from the spectral trend of the inner regions. More sensitive observations at higher frequencies (with sufficient resolution) are needed to determine the exact spectral index of the outermost regions. In Fig. 6 we fit a second-order polynomial to the measurements to illustrate the aged spectra.
Measured flux density values for the regions labeled A and E in the LOFAR image.
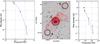 |
Fig. 6 Left: second-order polynomial fit for region A, represented by the dashed blue line. Middle: the 4C 35.06 radio source as seen by LOFAR, represented by red contours over an inverted grayscale SDSS image of the central region of the Abell 407 cluster. Overlaid in blue are the VLA 4885 MHz image contours. Black circles show the measurement areas in regions A, C, and E. Right: second-order polynomial fit (dashed blue line) for region E. The data points which are upper limits are represented with empty markers and downward pointing arrows. They are not taken into account in the fitting. |
4. Discussion
Figure 1 shows the radio emission around the galaxies comprising the Abell 407 core (catalogued as UGC 2489). We can see that there are two lobes detected by the VLA, and diffuse emission that extends to the northeast. Going farther out, this emission extends into a helical extension as seen in the grayscale WSRT image shown in the left panel of Fig. 2.
The extended emission to the northwest continues out to an even larger distance than previously known, i.e. ~ 210 kpc from the central region of 4C 35.06. It is labeled as region E in the LOFAR image (see Fig. 2).
The overall source morphology is suggestive of (at least) two distinct episodes of radio activity in 4C 35.06. The extended emission is a remnant of the previous active phase, whilst the twin lobes detected by the VLA show the current activity cycle.
Using the morphological and spectral results described above, we propose that 4C 35.06 can be interpreted as a source in which we are seeing (at least) two subsequent episodes of AGN activity.
To explain the complex radio morphology as well as the spectral indices we have derived, we propose that the AGN is intermittently active as it moves in the dense environment in the cluster core. In this scenario, the AGN turned on sometime in the past, and has produced the helical pattern of emission visible in the left panel of Fig. 2, possibly a sign of jet precession/merger during that episode of activity. Using LOFAR, we can trace the relic plasma from that episode of activity out to greater distances from the core than ever before. The spectral index maps of the source indicate that this phase of activity has resulted in an FRI-type radio galaxy (spectrum steepening from the core toward the edges). Then, the AGN activity has ceased (perhaps gradually), and after a period of time during which the host galaxy moved some distance to the position we observe it at now, it has started again, producing the less steep spectrum inner lobes. These lobes have clear double morphology, they are clearly outlined and both morphologically and spectrally distinct from the surrounding steeper spectrum region. At the present epoch, we observe an aged FRI-like large scale structure with an embedded restarted radio source, similar to the objects analyzed for example by Murgia et al. (2011), Giacintucci et al. (2007) and Ge & Owen (1994).
An alternative possibility would be that the different radio components (on small and large scales) belong to activity connected to different cores of UGC 2489 that were active at different times. For example, a core that could have been active in the past is the core labeled E in Schneider & Gunn (1982). It is located (in projection) to the northeast of the currently active AGN host core, and is co-spatial with the ridge of radio emission which continues out to larger scales. Biju et al. (2014) identify it as the origin of (at least) the large scale extended emission (they do not comment on the double lobed source morphology indicating restarted AGN activity to the southwest). The steeper spectral index of the ridge of radio emission, indicating old plasma (compared to the currently active double lobes just to the southwest of it) raise the possibility that this core hosted an active AGN sometime in the past and is responsible for the component of radio emission that is seen, in projection, associated with 4C 35.06. In our opinion, this is less likely; the optical core in question is less massive (judging by its optical luminosity compared to other nearby cores) than the currently active one and represents a less likely host of a SMBH.
We can estimate the AGN activity timescale by using galaxy kinematics. The cores of UGC 2489 are embedded in a common stellar envelope (probably a remnant of previous mergers). We assume that the core hosting the AGN is moving within the envelope and that the AGN is intermittently active. The radial velocity difference of the AGN host galaxy and the stellar envelope (as reported by Schneider & Gunn 1982) is 320 kms-1. Assuming that the radial velocity is equal to the velocity in the plane of the sky, the projection of the section of the orbit traversed can be estimated by measuring the current angular separation between the AGN host galaxy and the “ridge” of steeper spectrum emission to the northeast. This separation is 13′′ or 11.3 kpc at the distance of UGC 2489. Under the assumption that the shutdown and restart were near instantaneous, we get a lower limit for the elapsed time between the two episodes of AGN activity of around 35 Myr. It matches the duration of the AGN dormant phase of some of the fading radio sources reported in the sample of Parma et al. (2007), and also is in agreement with the derived duration of the inactive phases for the sample of Murgia et al. (2011). It is larger than the off times found (which are on the order of several Myr) for the two double-double radio galaxies studied by Konar et al. (2013).
We have been unable to unambiguously determine a spectral break in the integrated source spectrum. Furthermore, the images we have lack the proper frequency coverage at high spatial resolution to allow us to determine a spectral break and arrive at a radiative age estimate for the outermost emission regions.
We can estimate at what frequency would the spectral break be located for the aged plasma originating from the past activity episode (before the AGN shutdown). Following Murgia et al. (2011), the break frequency νb[GHz] is related to the magnetic field strength in the emission region B[μG] and the time elapsed ts[Myr] since the start of the activity as 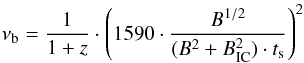 where BIC = 3.25(1 + z)2 is the inverse Compton equivalent magnetic field. We assume (for simplicity) that the active and shut down timescales of the AGN are the same, ts = 70 Myr in our case. Taking Region A as an example, we can estimate the value of its equi-partition magnetic field according to Govoni & Feretti (2004). For an electron to proton energy ratio of unity and a Lorentz factor of the lowest energy electrons of γ = 700, the magnetic field estimate is 2.8 μG, with a corresponding break frequency of νb = 3.3 GHz. However, the break frequency value depends critically on the value of the magnetic field which can vary substantially. For example, for the lowest values of the Lorentz factor, the magnetic field can be as high as 10 μG, with a corresponding spectral break frequency of 380 MHz. Such a value for the break frequency is plausible if we look at the spectral shape of Region A shown in Fig. 6, left panel.
Region E has a steeper spectrum than region A. This observation, (as well as the source morphology) is supported by the preliminary measurement of its flux density at 150 MHz using LOFAR (Marisa Brienza, priv. comm.). It may mean that region E is older; it may actually be the oldest source region that we observe.
Schneider & Gunn (1982) estimate that the UGC 2489 galaxies will merge owing to dynamical friction (as shown by the stellar envelope surrounding the galaxies, created by stripping) in at most 2 Gyr, leaving us the possibility for the AGN to experience a series of outbursts before the final merger.
An interesting similar example is presented by the radio source 3C 338, hosted by the cD galaxy (NGC 6166) in the core of the galaxy cluster Abell 2199. This is a steep spectrum radio source (α< −1.5). The radio morphology (Ge & Owen 1994) is suggestive of a restarted source, with at least two phases of AGN activity, where the oldest radio plasma appears to be offset from an active core. In these respects, this radio source is very similar to 4C 35.06. However, 3C 338 is different from 4C 35.06 in that the older plasma in its central regions has no optical core counterpart, which gives a stronger support to the argument that in the case of 3C 338 the currently active core was the source for the older plasma. Burns et al. (1983) give a thorough overview of radio sources hosted by cluster core galaxies and suggest how the motion of the AGN host galaxy can give rise to a radio morphology similar to what we observe. We note that merging of galaxy cores on timescales of 107 yr can trigger an activity episode, which is in agreement with the derived dormant time for 4C 35.06.
In these types of restarted radio sources which are located in galaxy clusters, there is a possibility that the ICM medium is dense enough near the cluster core, increasing confinement pressure. It can have an impact on any older outburst of AGN plasma, keeping it confined for longer periods of time, and prolonging the time in which it can be detected by low-frequency radio observations such as we are presenting in this work.
4.1. Presence of cold gas
The detection of neutral hydrogen adds a new interesting component to the study of this object.
H I in absorption has been detected before in clusters (for example Abell 2597 (PKS 2322-123) O’Dea et al. 1994; Taylor et al. 1999), Abell 1795 (4C 26.42, Van Bemmel et al. 2012) in addition to other famous objects in centers of clusters, like Hydra A (Taylor 1996) and Cygnus A (Struve & Conway 2010). Although a systematic inventory of the occurrence of H I in clusters is not yet available, the statistics seems to be biased toward observing and detecting H I in the center of cooling core clusters. Abell 407 likely does not belong to this group, having a core which is not relaxed, but nevertheless we detect H I.
The fact that 4C 35.06 is a restarted radio source may suggest a connection between the presence of gas and the restarting of the radio-loud phase: indeed such a relation is often seen in non-cluster radio sources. There, restarted radio sources show an incidence of H I detections higher than in other extended sources (Saikia et al. 2007; Chandola et al. 2010, 2011; Morganti et al. 2005).
However, the H I profile detected in 4C 35.06 appears to be broader than in typical radio galaxies (Gereb et al. 2014). However, it resembles some of the profiles found in other clusters (in particular Abell 2597 and Abell 1795 mentioned above) that show relatively broad wings in the H I absorption profile, perhaps a signature of the more disturbed kinematics of the gas due to the cluster environment, as seen also in molecular gas by McNamara et al. (2014) derived from ALMA data of Abell 1835.
In low-luminosity radio sources with low-excitation spectra like 4C 35.06, the possibility of the activity being supported by gas cooling from the hot galactic halo via e.g. Bondi accretion has been suggested by several studies (Croton et al. 2006; Allen et al. 2006; Hardcastle et al. 2007; Balmaverde et al. 2008). Taking the core luminosity measured by Liuzzo et al. (2010) and following the reasoning of Balmaverde et al. (2008), connecting the radio core luminosity to the radio jet power and relating that to the Bondi accretion power (PB = 0.1Ṁc2), we estimate that the accretion rate of 4C 35.06 is on the order of 0.2 M⊙ yr-1.
If part of the detected H I is associated with infalling gas (something possible given the width of the profile that also spans to redshifted velocities) it could provide the required fueling material. The gas could be chaotically losing angular momentum in the ISM of the AGN host and accreting, as suggested by Gaspari et al. (2013).
5. Conclusions
Studying the field centered on the nearby Compact Steep Spectrum radio source B2 0258+35A (observed during the commissioning of LOFAR), we have made a 61 MHz map of 4C 35.06 (B2 0258+35B), a radio source hosted by the core of the galaxy cluster Abell 407. This source has a complex morphology on several spatial scales. We used our LOFAR image in combination with archival VLA imaging as well as VLSS, WENSS and other survey data to argue that the most extended emission can be interpreted as a remnant of a past episode of AGN activity. The integrated spectral index is moderately steep and shows no signs of spectral curvature. We confirm the existence of an extended emission region and derive spectral index maps of the inner parts of the source closer to the AGN.
We discuss two possible scenarios regarding the nature of the source and conclude that the best explanation is that we observe two distinct episodes of AGN activity in 4C 35.06. Fitting a radiative ageing model to the spectrum of the central source region (encompassing the currently active AGN as well as aged plasma) we conclude that it is at most 10 Myr old, while age estimates (based on galaxy kinematics and radio spectral shape) for a source region farther away from the AGN show it to be older by at least a factor of a few. Although the outer region age estimates are less precise, they support the suggestion of multiple phases of activity.
We also present a discovery of H I in absorption at the location of the (currently active) AGN host galaxy. The H I detection has a broad profile, suggestive of a complex gas dynamics and a possible outflow.
A better handle of the timescales involved can be obtained by better spectral coverage at sufficient resolution to disentangle the various source structures. Depending on the relative contributions of the smaller scales, our study shows that it is possible to use the integrated source spectrum as a proxy to learn more about the spectral behavior on smaller scales and the source activity history. This is important in studies of more distant sources which in general would be unresolved in future surveys. It is usually assumed that relic sources at high redshift should have very steep spectra, since we observe the exponential cutoff in their spectra which in our frame of reference is shifted to lower frequencies. However, for some of these sources, restarted activity may modify their (integrated) spectral shapes such that they would be less steep. An example of such a case is presented by the integrated flux density spectrum of 4C 35.06, the source we have studied in this work. Our observations suggest that we have to be careful and possibly modify our radio selection criteria of high-redshift sources.
We use the S ∝ να definition for the spectral index α throughout this writing.
VLSS (Cohen et al. 2007) is the VLA Low frequency Sky Survey carried out at a frequency of 74 MHz.
WENSS stands for the Westerbork Northern Sky Survey carried out at a frequency of 325 MHz (Rengelink et al. 1997).
NVSS stands for the NRAO VLA Sky Survey carried out at a frequency of 1.4 GHz (Condon et al. 1998).
Acknowledgments
LOFAR, the Low Frequency Array designed and constructed by ASTRON, has facilities in several countries that are owned by various parties (each with their own funding sources), and that are collectively operated by the International LOFAR Telescope (ILT) foundation under a joint scientific policy. Data taken with the Westerbork Synthesis Radio Telescope were part of this work. It is operated by ASTRON (Netherlands Institute for Radio Astronomy) with support from the Netherlands Foundation for Scientific Research (NWO). This research has made use of the NASA/IPAC Extragalactic Database (NED), which is operated by the Jet Propulsion Laboratory, California Institute of Technology, under contract with the National Aeronautics and Space Administration. The VLA images used in this work were produced as part of the NRAO VLA Archive Survey, (c) AUI/NRAO. This research has made use of APLpy, an open-source plotting package for Python hosted at http://aplpy.github.com. R.M. gratefully acknowledges support from the European Research Council under the European Union’s Seventh Framework Programme (FP/2007−2013)/ERC Advanced Grant RADIOLIFE-320745. R.Jv.W. acknowledges the support by NASA through the Einstein Postdoctoral grant number PF2-130104 awarded by the Chandra X-ray Center, which is operated by the Smithsonian Astrophysical Observatory for NASA under contract NAS8-03060.
References
- Aihara, H., Allen de Prieto, C., An, D., et al. 2011, ApJS, 193, 29 [NASA ADS] [CrossRef] [Google Scholar]
- Allen, S. W., Dunn, R. J. H., Fabian, A. C., Taylor, G. B., & Reynolds, C. S. 2006, MNRAS, 372, 21 [NASA ADS] [CrossRef] [Google Scholar]
- Baars, J. W. M., Genzel, R., Pauliny-Toth, I. I. K., & Witzel, A. 1977, A&A, 61, 99 [NASA ADS] [Google Scholar]
- Balmaverde, B., Baldi, R. D., & Capetti, A. 2008, A&A, 486, 119 [NASA ADS] [CrossRef] [EDP Sciences] [Google Scholar]
- Best, P. N., & Heckman, T. M. 2012, MNRAS, 421, 1569 [NASA ADS] [CrossRef] [Google Scholar]
- Biju, K. G., Pandey-Pommier, M., Sunilkumar, P., et al. 2014 [arXiv:1411.7261v1] [Google Scholar]
- Bondi, M., Gregorini, L., Padrielli, L., & Parma, P. 1993, A&AS, 101, 431 [NASA ADS] [Google Scholar]
- Bridle, A. H., Kesteven, M. J. L., & Brandie, G. W. 1977, AJ, 82, 21 [NASA ADS] [CrossRef] [Google Scholar]
- Briggs, D. S. 1995, Ph.D. Thesis, New Mexico Institute of Mining Technology, Socorro, New Mexico, USA, http://www.aoc.nrao.edu/dissertations/dbriggs/ [Google Scholar]
- Burns, J. O., Schwendeman, E., & White, R. A. 1983, ApJ, 271, 575 [NASA ADS] [CrossRef] [Google Scholar]
- Chandola, Y., Saikia, D. J., & Gupta, N. 2010, MNRAS, 403, 269 [NASA ADS] [CrossRef] [Google Scholar]
- Chandola, Y., Sirothia, S. K., & Saikia, D. J. 2011, MNRAS, 418, 1787 [NASA ADS] [CrossRef] [Google Scholar]
- Chen, J., Huchra, J. P., McNamara, B., & Mader, J. 1998, BAAS, 30. Online at: https://www.cfa.harvard.edu/~dfabricant/huchra/clusters/ [Google Scholar]
- Cohen, A. S., Lane, W. M., Cotton, W. D., et al. 2007, AJ, 134, 1245 [NASA ADS] [CrossRef] [Google Scholar]
- Colla, G., Fanti, C., Fanti, R., et al. 1973, A&AS, 11, 291 [NASA ADS] [Google Scholar]
- Condon, J. J., Cotton, W. D., Greisen, E. W., et al. 1998, ApJ, 115, 1693 [Google Scholar]
- Cornwell, T. J. 2008, IEEE JSTSP, 2, 793 [Google Scholar]
- Crawford, C. S., Allen, S. W., Ebeling, H., Edge, A. C., & Fabian, A. C. 1999, MNRAS, 306, 857 [NASA ADS] [CrossRef] [Google Scholar]
- Croton, D. J., Springel, V., White, S. D. M., et al. 2006, MNRAS, 365, 11 [NASA ADS] [CrossRef] [Google Scholar]
- De Gasperin, F., Orrú, E., Murgia, M., et al. 2012, A&A, 547, A56 [NASA ADS] [CrossRef] [EDP Sciences] [Google Scholar]
- Gaspari, M., Ruszkowski, M., & Oh, S. P. 2013, MNRAS, 432, 3401 [NASA ADS] [CrossRef] [Google Scholar]
- Ge, J., & Owen, F. N. 1994, AJ, 108, 1523 [NASA ADS] [CrossRef] [Google Scholar]
- Gereb, K., Morganti, R., & Oosterloo, T. 2014, A&A, 569, A35 [NASA ADS] [CrossRef] [EDP Sciences] [Google Scholar]
- Giacintucci, S., Venturi, T., Murgia, M., et al. 2007, A&A, 476, 99 [NASA ADS] [CrossRef] [EDP Sciences] [Google Scholar]
- Govoni, F., & Feretti, L. 2004, IJMP(D), 13, 1549 [NASA ADS] [Google Scholar]
- Gregorini, L., Padrielli, L., Parma, P., & Gilmore, G. 1998, A&AS, 74, 107 [Google Scholar]
- Gregory, P. C., & Condon, J. J. 1991, ApJSS, 75, 1011 [NASA ADS] [CrossRef] [Google Scholar]
- Hardcastle, M. J., Evans, D. A., & Croston, J. H. 2007, MNRAS, 376, 1849 [NASA ADS] [CrossRef] [Google Scholar]
- Helemboldt, J. F., Kassim, N. E., Cohen, A. S., Lane, W. M., & Lazio, T. J. 2008, ApJSS, 174, 313 [NASA ADS] [CrossRef] [Google Scholar]
- Jaffe, W. J., & Perola, G. C. 1973, A&A, 26, 423 [NASA ADS] [Google Scholar]
- Kardashev, N. S. 1962, Astron. Zh., 39, 393 [Google Scholar]
- Klein, U., & Emerson, D. T. 1981, A&A, 94, 29 [NASA ADS] [Google Scholar]
- Komissarov, S. S., & Gubanov, A. G. 1994, A&A, 285, 27 [NASA ADS] [Google Scholar]
- Konar, C., Hardcastle, M. J., Jamrozy, M., & Croston, J. H. 2013, MNRAS, 430, 2137 [NASA ADS] [CrossRef] [Google Scholar]
- Kunert-Bajraszewska, M., Janiuk, A., Gawronski, M. P., & Siemiginowska, A. 2010, ApJ, 718, 1345 [NASA ADS] [CrossRef] [Google Scholar]
- Liuzzo, E., Giobannini, G., Giroletti, M., & Taylor, G. B. 2010, A&A, 516, A1 [NASA ADS] [CrossRef] [EDP Sciences] [Google Scholar]
- McMullin, J. P., Waters, B., Schiebel, D., Young, W., & Golap, K. 2007, ASP Conf. Ser., 376, 127 [Google Scholar]
- McNamara, B. R., Wise, M., Nulsen, P. E. J., et al. 2000, ApJ, 534, L135 [CrossRef] [Google Scholar]
- McNamara, B. R., Russel, H. R, Nulsen, P. E. J., et al. 2014, ApJ, 785, 44 [NASA ADS] [CrossRef] [Google Scholar]
- Miley, G. 1980, ARA&A, 18, 165 [Google Scholar]
- Morganti, R., Oosterloo, T. A., Tadhunter, C. N., van Moorsel, G., & Emonts, B. 2005, A&A, 439, 521 [NASA ADS] [CrossRef] [EDP Sciences] [Google Scholar]
- Murgia, M., Parma, P., Mack, K. H., et al. 2011, A&A, 526, A19 [NASA ADS] [CrossRef] [EDP Sciences] [Google Scholar]
- O’Dea, C. P. 2002, New Astron. Rev., 46, 41 [NASA ADS] [CrossRef] [Google Scholar]
- O’Dea, C. P., Baum, S. A., & Gallimore, J. F. 1994, ApJ, 436, 669 [NASA ADS] [CrossRef] [Google Scholar]
- Offringa, A. R., van de Gronde, J. J., & Roerdink, J. B. T. M. 2012, A&A, 539, A95 [NASA ADS] [CrossRef] [EDP Sciences] [Google Scholar]
- Parma, P., Murgia, M., de Ruiter, H. R., et al. 2007, A&A, 470, 875 [NASA ADS] [CrossRef] [EDP Sciences] [Google Scholar]
- Pilkington, J. D. H., & Scott, J. F. 1965, MNRAS, 69, 183 [NASA ADS] [Google Scholar]
- Ramanujam, N. M. 2007, Anaamika v 2.1, http://www.strw.leidenuniv.nl/~mohan/anaamika [Google Scholar]
- Readhead, A. C., & Hewish, A. 1974, MNRAS, 167, 663 [NASA ADS] [CrossRef] [Google Scholar]
- Rengelink, R. B., Tang, Y., de Bruyn, A. G., et al. 1997, A&AS, 124, 259 [NASA ADS] [CrossRef] [EDP Sciences] [Google Scholar]
- Sault, R J., Teuben, P. J., & Wright, M. C. H. 1995, ASP Conf. Ser., 77, 433 [NASA ADS] [Google Scholar]
- Saikia, D. J., & Jamrozy, M. 2009, Bull. Astron. Soc. India, 37, 63 [NASA ADS] [Google Scholar]
- Saikia, D. J., Gupta, N., & Konar, C. 2007, MNRAS, 375, L31 [NASA ADS] [CrossRef] [Google Scholar]
- Schneider, D. P., & Gunn, J. E. 1982, A&A, 263, 14 [NASA ADS] [Google Scholar]
- Schoenmakers, A. P., de Bruyn, A. G., Röttgering, H. J. A., van der Laan, H., & Kaiser, C. R. 2000, MNRAS, 315, 371 [NASA ADS] [CrossRef] [Google Scholar]
- Struve, C., & Conway, J. E. 2010, A&A, 513, A10 [NASA ADS] [CrossRef] [EDP Sciences] [Google Scholar]
- Taylor, G. B. 1996, AJ, 470, 394 [Google Scholar]
- Taylor, G. B., O’Dea, C. P., Peck, A. B., & Koekemoer, A. M. 1999, ApJ, 512, L27 [NASA ADS] [CrossRef] [Google Scholar]
- Van Bemmel, I., Morganti, R., Oosterloo, T., & van Moorsel, G. 2012, A&A, 548, A93 [NASA ADS] [CrossRef] [EDP Sciences] [Google Scholar]
- Van Haarlem, M. P., Wise, M. W., Gunst, A. W., et al. 2013, A&A, 556, A2 [NASA ADS] [CrossRef] [EDP Sciences] [Google Scholar]
- Van Weeren, R. J., Röttgering, H. J. A., Brueggen, M., & Cohen, A. 2009, A&A, 508, 75 [NASA ADS] [CrossRef] [EDP Sciences] [Google Scholar]
- Van Weeren, R. J., Röttgering, H. J. A., Rafferty, D. A., Pizzo, R., et al. 2012, A&A, 543, A43 [NASA ADS] [CrossRef] [EDP Sciences] [Google Scholar]
- Verkhodanov, O. V., Trushkin, S A., Andernach, H., & Cherenkov, V. N. 2009, BSAO, 58, 118 [Google Scholar]
- Viner, M. R., & Erickson, W. C. 1975, AJ, 80, 931 [NASA ADS] [CrossRef] [Google Scholar]
- Wright, E. L. 2006, PASP, 118, 1711 [NASA ADS] [CrossRef] [Google Scholar]
- Zhang, X., Zheng, Y., Chen, H., et al. 1997, A&AS, 121, 59 [NASA ADS] [CrossRef] [EDP Sciences] [Google Scholar]
All Tables
All Figures
|
Fig. 1 Optical image of UGC 2489 taken from the Sloan Digital Sky Survey (SDSS, Aihara et al. 2011) showing its multi-component core structure. The red intensity overlay shows a 4885 MHz VLA archival image. In yellow we over-plot contours from a 1415 MHz VLA archival image. Contours are log scaled, there are 10 contour levels going from 4σ to 500σ. Details about the VLA images can be found in Table 1. The stellar halo around the cores is roughly 40 kpc in extent. The position of the core hosting the AGN is shown with a black cross. |
| In the text | |
|
Fig. 2 Left: WSRT 1360 MHz continuum image of 4C 35.06. Overlaid in red are contours taken from the same image, with levels (− 5,15,150)σ, while plotted in black are 4885 MHz VLA contours of the central region with contour levels of (− 5,50,100,200,350)σ. The WSRT beam is shown in the lower left corner. Middle: the 4C 35.06 radio source as seen by LOFAR at 62 MHz, represented by red contours (33 levels spanning (− 3,183)σ) over an inverted grayscale SDSS image of the central region of the Abell 407 cluster. The peak flux density in this map is 9.1 Jy. Regions in the LOFAR map are labeled A through E. Overlaid in blue are the VLA 4885 MHz image contours. Right: LOFAR 62 MHz (red) and VLA 1415 MHz (blue) contours overlaid over an inverted grayscale SDSS image of the cluster core (UGC 2489). The location of the core hosting the AGN is indicated with a white star. Arrows show the extent and the location of the regions of interest in different images. The relevant beam sizes and noise levels of the images are given in Table 1. |
| In the text | |
|
Fig. 3 H I absorption profile in 4C 35.06 (Hanning smoothing applied). The full vertical line indicates the systemic velocity of 4C 35.06 host galaxy, while the two vertical dashed lines show the highest and lowest velocity of the galaxies in the cluster core. |
| In the text | |
|
Fig. 4 Integrated flux density values for 4C 35.06 based on the data listed in Table 3 (circles) and its central region (stars). The LOFAR data points are in red. The green line represents a power law fit, while the blue dashed line gives the synchrotron aging model fit for region C. |
| In the text | |
|
Fig. 5 Left: |
| In the text | |
|
Fig. 6 Left: second-order polynomial fit for region A, represented by the dashed blue line. Middle: the 4C 35.06 radio source as seen by LOFAR, represented by red contours over an inverted grayscale SDSS image of the central region of the Abell 407 cluster. Overlaid in blue are the VLA 4885 MHz image contours. Black circles show the measurement areas in regions A, C, and E. Right: second-order polynomial fit (dashed blue line) for region E. The data points which are upper limits are represented with empty markers and downward pointing arrows. They are not taken into account in the fitting. |
| In the text | |
Current usage metrics show cumulative count of Article Views (full-text article views including HTML views, PDF and ePub downloads, according to the available data) and Abstracts Views on Vision4Press platform.
Data correspond to usage on the plateform after 2015. The current usage metrics is available 48-96 hours after online publication and is updated daily on week days.
Initial download of the metrics may take a while.