Free Access
Fig. 3
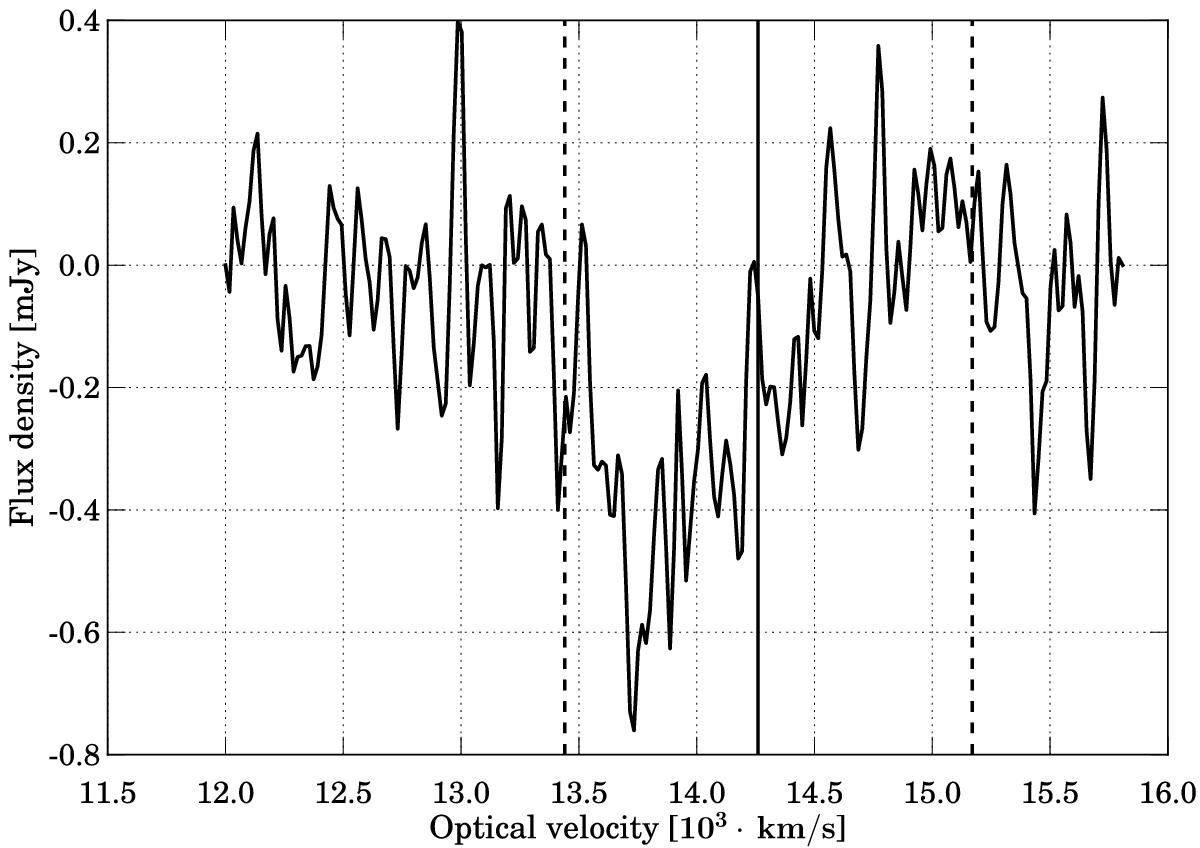
H I absorption profile in 4C 35.06 (Hanning smoothing applied). The full vertical line indicates the systemic velocity of 4C 35.06 host galaxy, while the two vertical dashed lines show the highest and lowest velocity of the galaxies in the cluster core.
Current usage metrics show cumulative count of Article Views (full-text article views including HTML views, PDF and ePub downloads, according to the available data) and Abstracts Views on Vision4Press platform.
Data correspond to usage on the plateform after 2015. The current usage metrics is available 48-96 hours after online publication and is updated daily on week days.
Initial download of the metrics may take a while.