Fig. 6
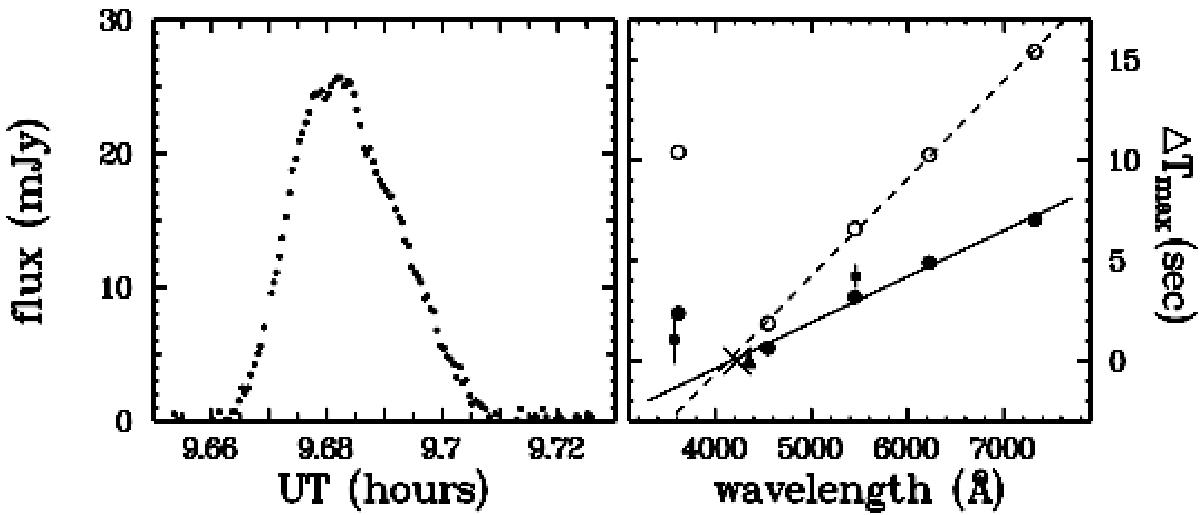
Left frame: a flickering flare of SS Cyg centred on 4545 Å on 1998, July 8, as observed by Pearson et al. (2005). Right frame: ΔTmax as a function of wavelength of the comparison band for the observational data (filled circles) and the preferred fireball model (open circles). The solid and broken lines represent a linear least-squares fit to the data points (shortest wavelength point excluded). The location of the reference band is indicated by a cross. The dots with error bars are the average ΔTmax values of SS Cyg taken from Table 1, with the triangle representing the location of the respective reference band.
Current usage metrics show cumulative count of Article Views (full-text article views including HTML views, PDF and ePub downloads, according to the available data) and Abstracts Views on Vision4Press platform.
Data correspond to usage on the plateform after 2015. The current usage metrics is available 48-96 hours after online publication and is updated daily on week days.
Initial download of the metrics may take a while.