Fig. 5
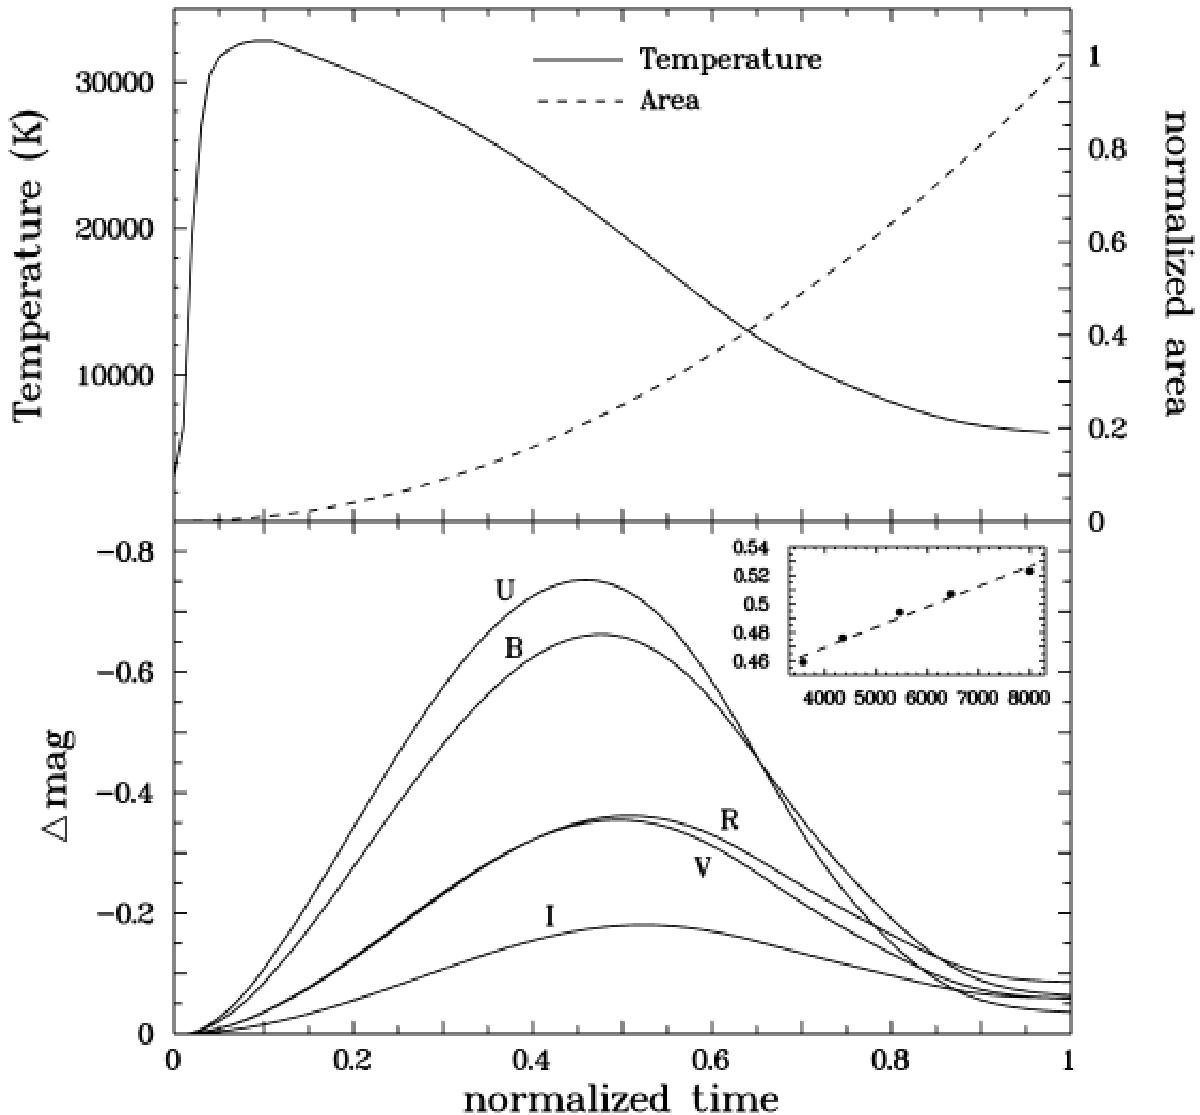
Top: assumed temperature (solid line, left-hand scale) and emitting area (broken line, right-hand scale) evolution of a black body used in simulations of the brightness development of a flickering flare as a function of time. Bottom: calculated profiles of a simulated flickering flare in the bands of the UBVRI system. The inset shows the times of maxima (dots) as a function of the isophotal wavelength of the respective bands, together with a linear least-square fit (broken line). See text for details.
Current usage metrics show cumulative count of Article Views (full-text article views including HTML views, PDF and ePub downloads, according to the available data) and Abstracts Views on Vision4Press platform.
Data correspond to usage on the plateform after 2015. The current usage metrics is available 48-96 hours after online publication and is updated daily on week days.
Initial download of the metrics may take a while.