Fig. 4
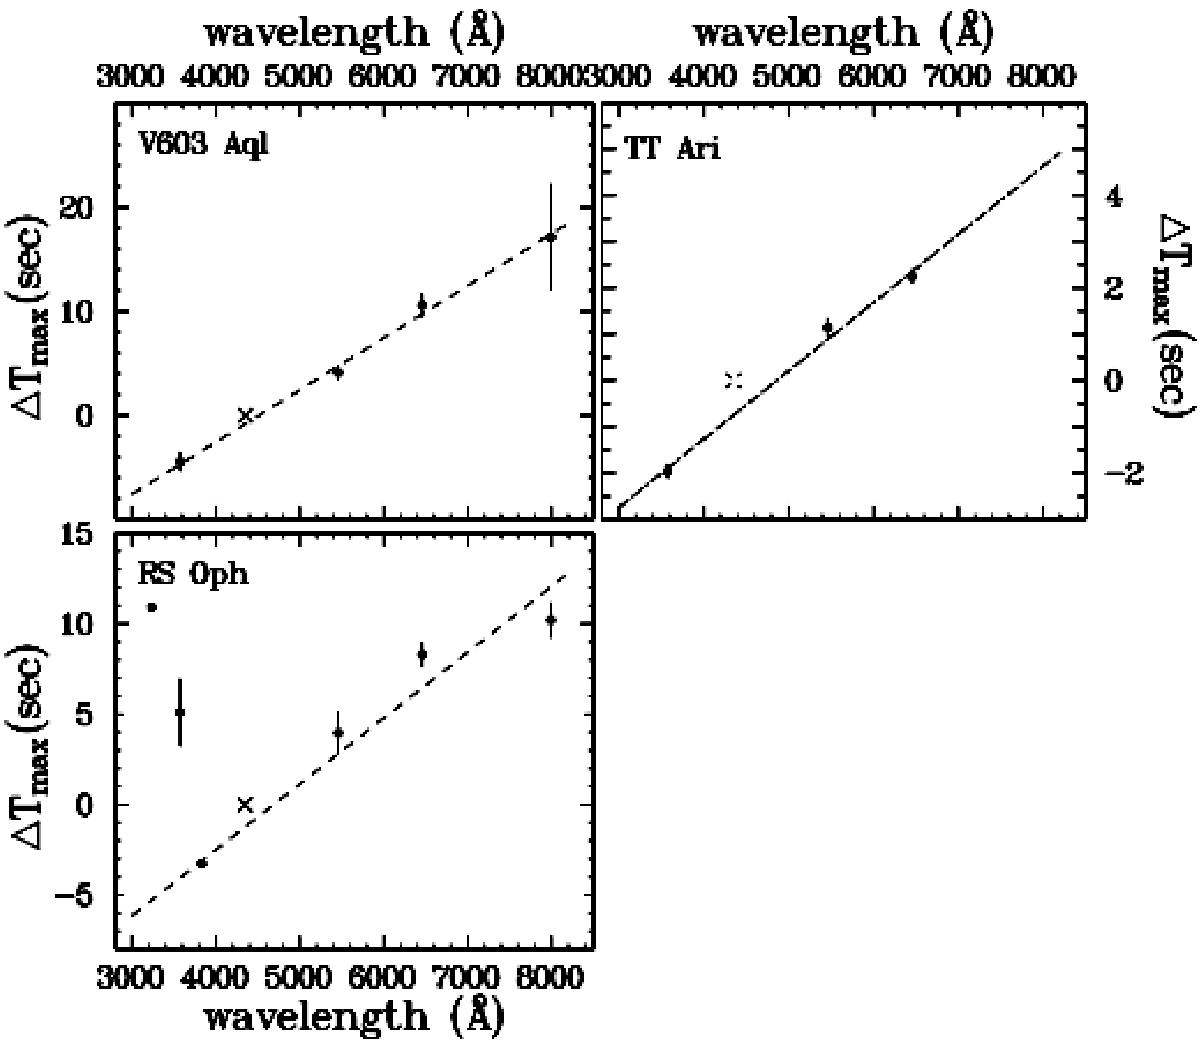
Average ΔTmax derived from high time resolution light curves of V603 Aql, TT Ari and RS Oph as a function of isophotal wavelength of the comparison band. The broken lines are linear least-squares fits to the data points (in the case of RS Oph without considering the points referring to the W and U bands), weighted by the inverse of their standard deviations. The location of the reference band (B) is indicated by a cross. The error bars represent the mean error of the mean.
Current usage metrics show cumulative count of Article Views (full-text article views including HTML views, PDF and ePub downloads, according to the available data) and Abstracts Views on Vision4Press platform.
Data correspond to usage on the plateform after 2015. The current usage metrics is available 48-96 hours after online publication and is updated daily on week days.
Initial download of the metrics may take a while.