Fig. 3
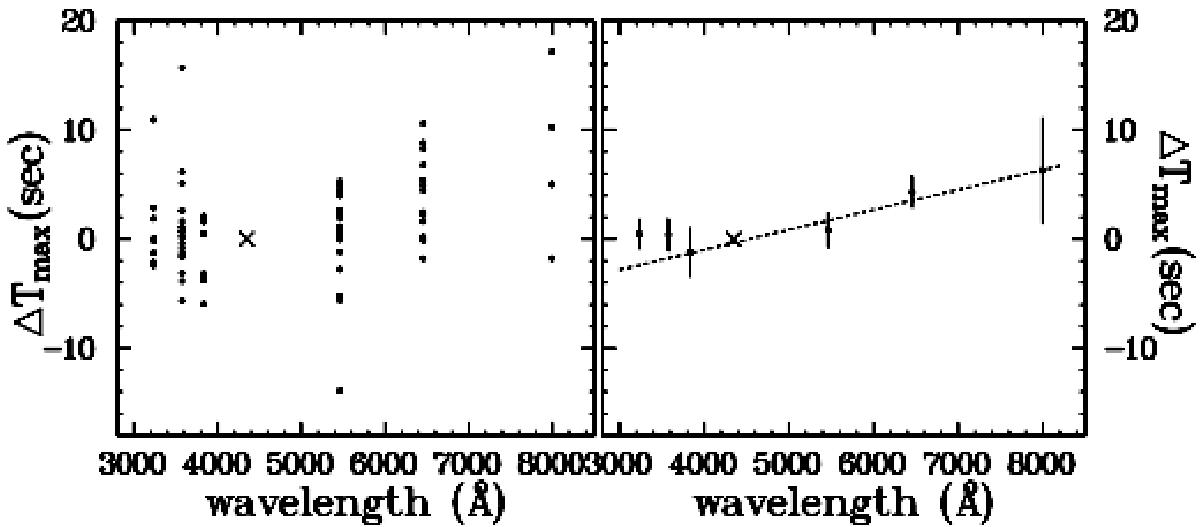
Left: average ΔTmax for all investigated CVs as a function of isophotal wavelength of the comparison band. Right: average ΔTmax of all individual light curves, weighted in proportion to their duration. The broken line is a linear least-squares fit to the data points (excluding the points referring to the W and U bands), weighted by the inverse of their standard deviations. The error bars represent the mean error of the mean. In both frames the location of the reference band (B) is indicated by a cross.
Current usage metrics show cumulative count of Article Views (full-text article views including HTML views, PDF and ePub downloads, according to the available data) and Abstracts Views on Vision4Press platform.
Data correspond to usage on the plateform after 2015. The current usage metrics is available 48-96 hours after online publication and is updated daily on week days.
Initial download of the metrics may take a while.