Fig. 2
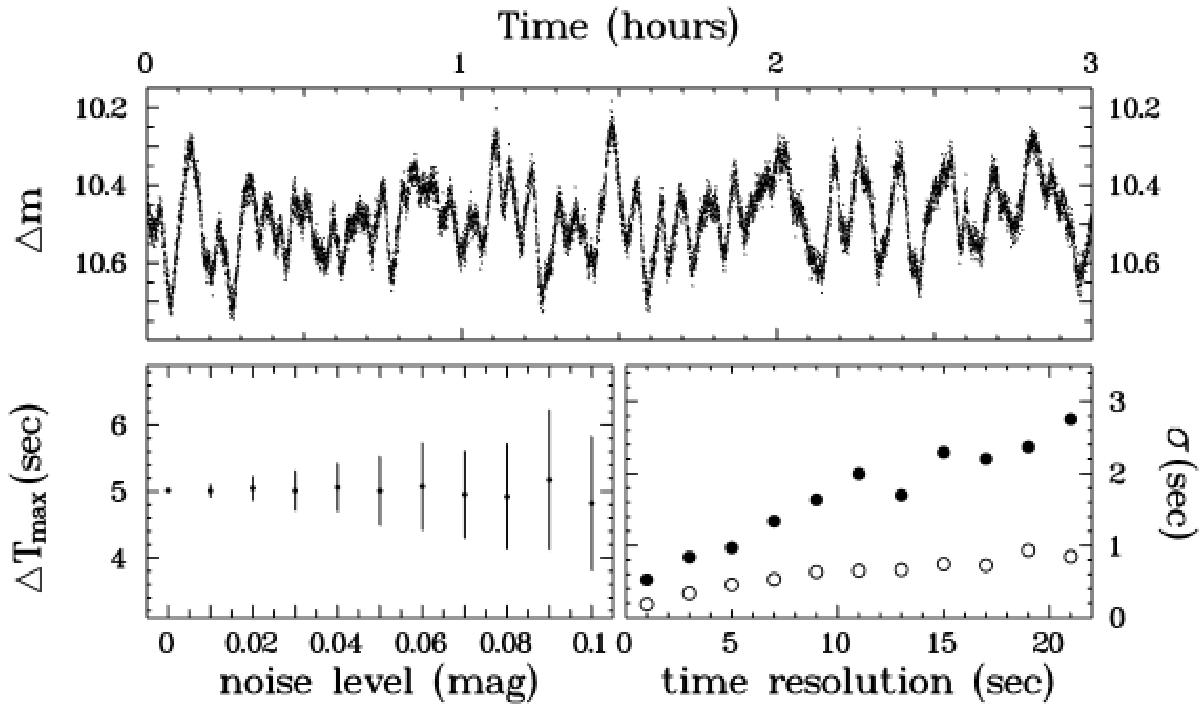
Top: artificial flickering light curve used to estimate the accuracy
of the determination of flickering time lags. Bottom left: dependence
of ΔTmax on the noise level.
Bottom right: expected error of ΔTmax as a
function of the time resolution of the light curve for low
(0![]() 02; open symbols) and moderately high
(0
02; open symbols) and moderately high
(0![]() 05; filled symbols) noise levels.
05; filled symbols) noise levels.
Current usage metrics show cumulative count of Article Views (full-text article views including HTML views, PDF and ePub downloads, according to the available data) and Abstracts Views on Vision4Press platform.
Data correspond to usage on the plateform after 2015. The current usage metrics is available 48-96 hours after online publication and is updated daily on week days.
Initial download of the metrics may take a while.