Fig. 2
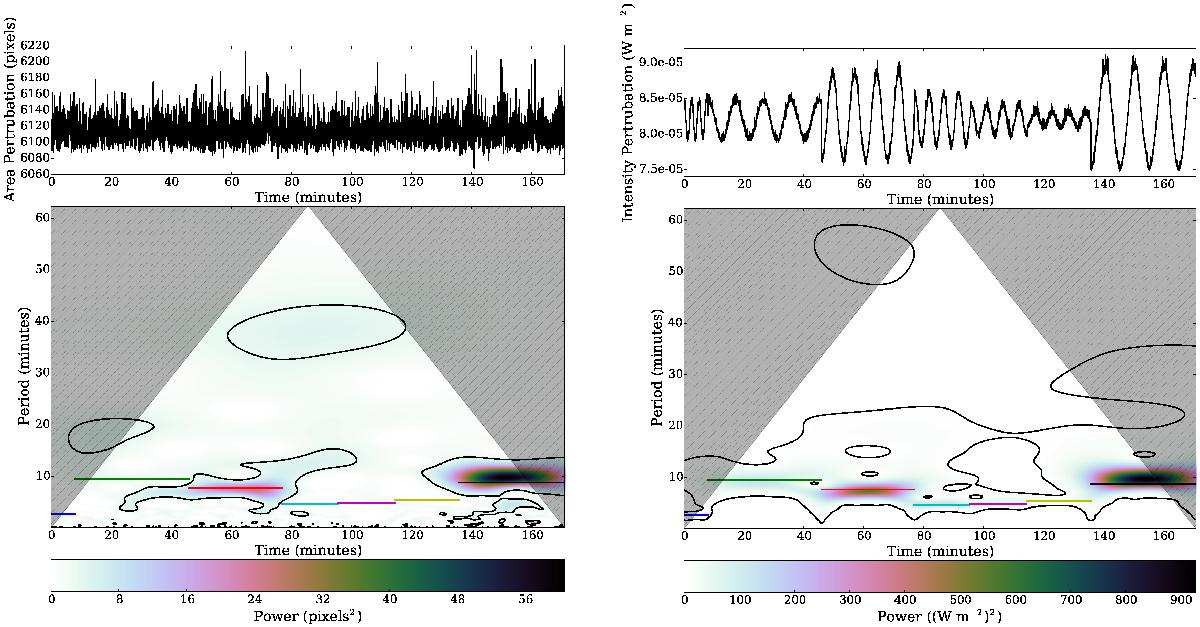
Top image: time series for the area (left) and intensity (right), bottom: wavelet power spectrum of the time series. The grey area is the region where boundary issues from the wavelet process can occur, known as the cone of influence. The coloured lines indicate the time intervals used in the Fourier analysis and are placed at the period found from Fourier analysis.
Current usage metrics show cumulative count of Article Views (full-text article views including HTML views, PDF and ePub downloads, according to the available data) and Abstracts Views on Vision4Press platform.
Data correspond to usage on the plateform after 2015. The current usage metrics is available 48-96 hours after online publication and is updated daily on week days.
Initial download of the metrics may take a while.