Fig. 9
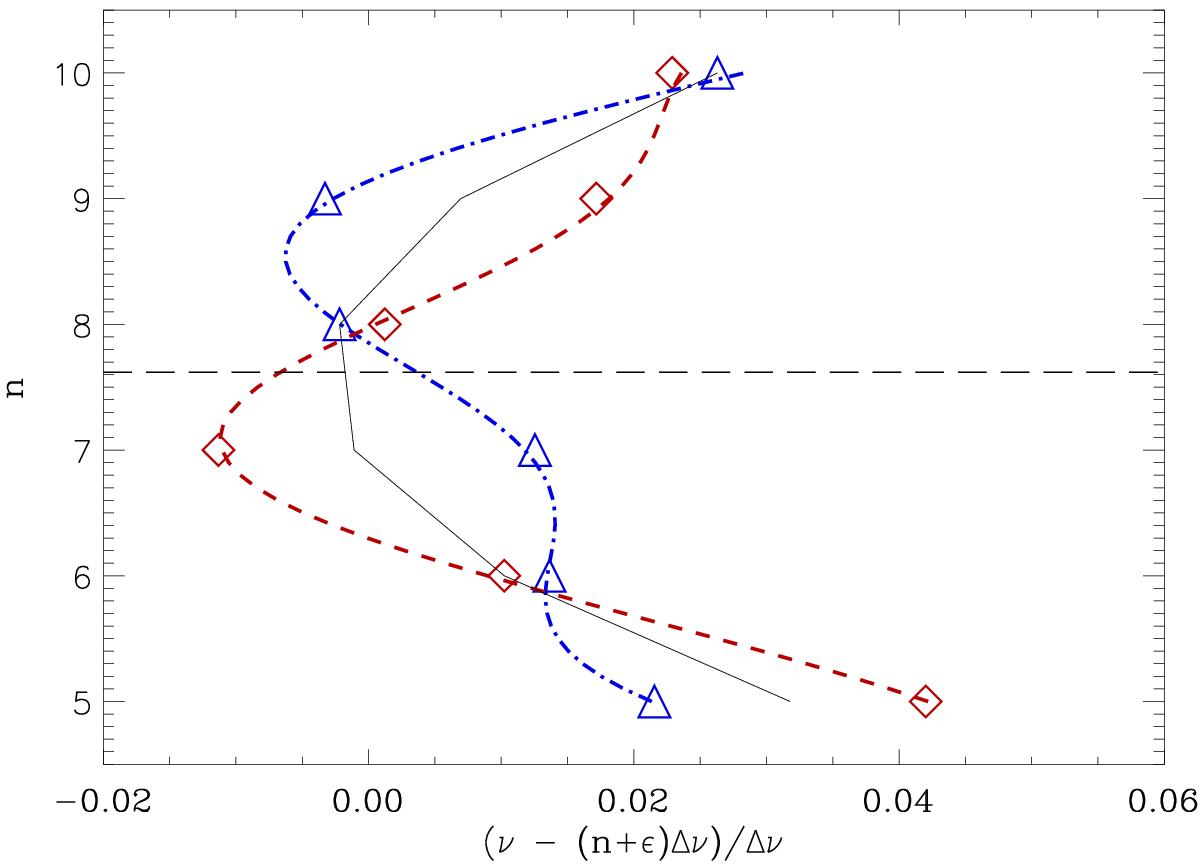
Synthetic échelle diagram of the radial modes of a typical red giant star with a large separation of 3.90 μHz. The glitch contributions are overplotted with a dashed red line and red diamonds for a typical clump star, and with a dot-dashed blue line and blue triangles for a typical RGB star. The horizontal dashed black line with a n value of approximately 7.6 represents the nmax value. Only six radial modes are shown in this figure, which is typically the number of observed modes.
Current usage metrics show cumulative count of Article Views (full-text article views including HTML views, PDF and ePub downloads, according to the available data) and Abstracts Views on Vision4Press platform.
Data correspond to usage on the plateform after 2015. The current usage metrics is available 48-96 hours after online publication and is updated daily on week days.
Initial download of the metrics may take a while.