Fig. 4
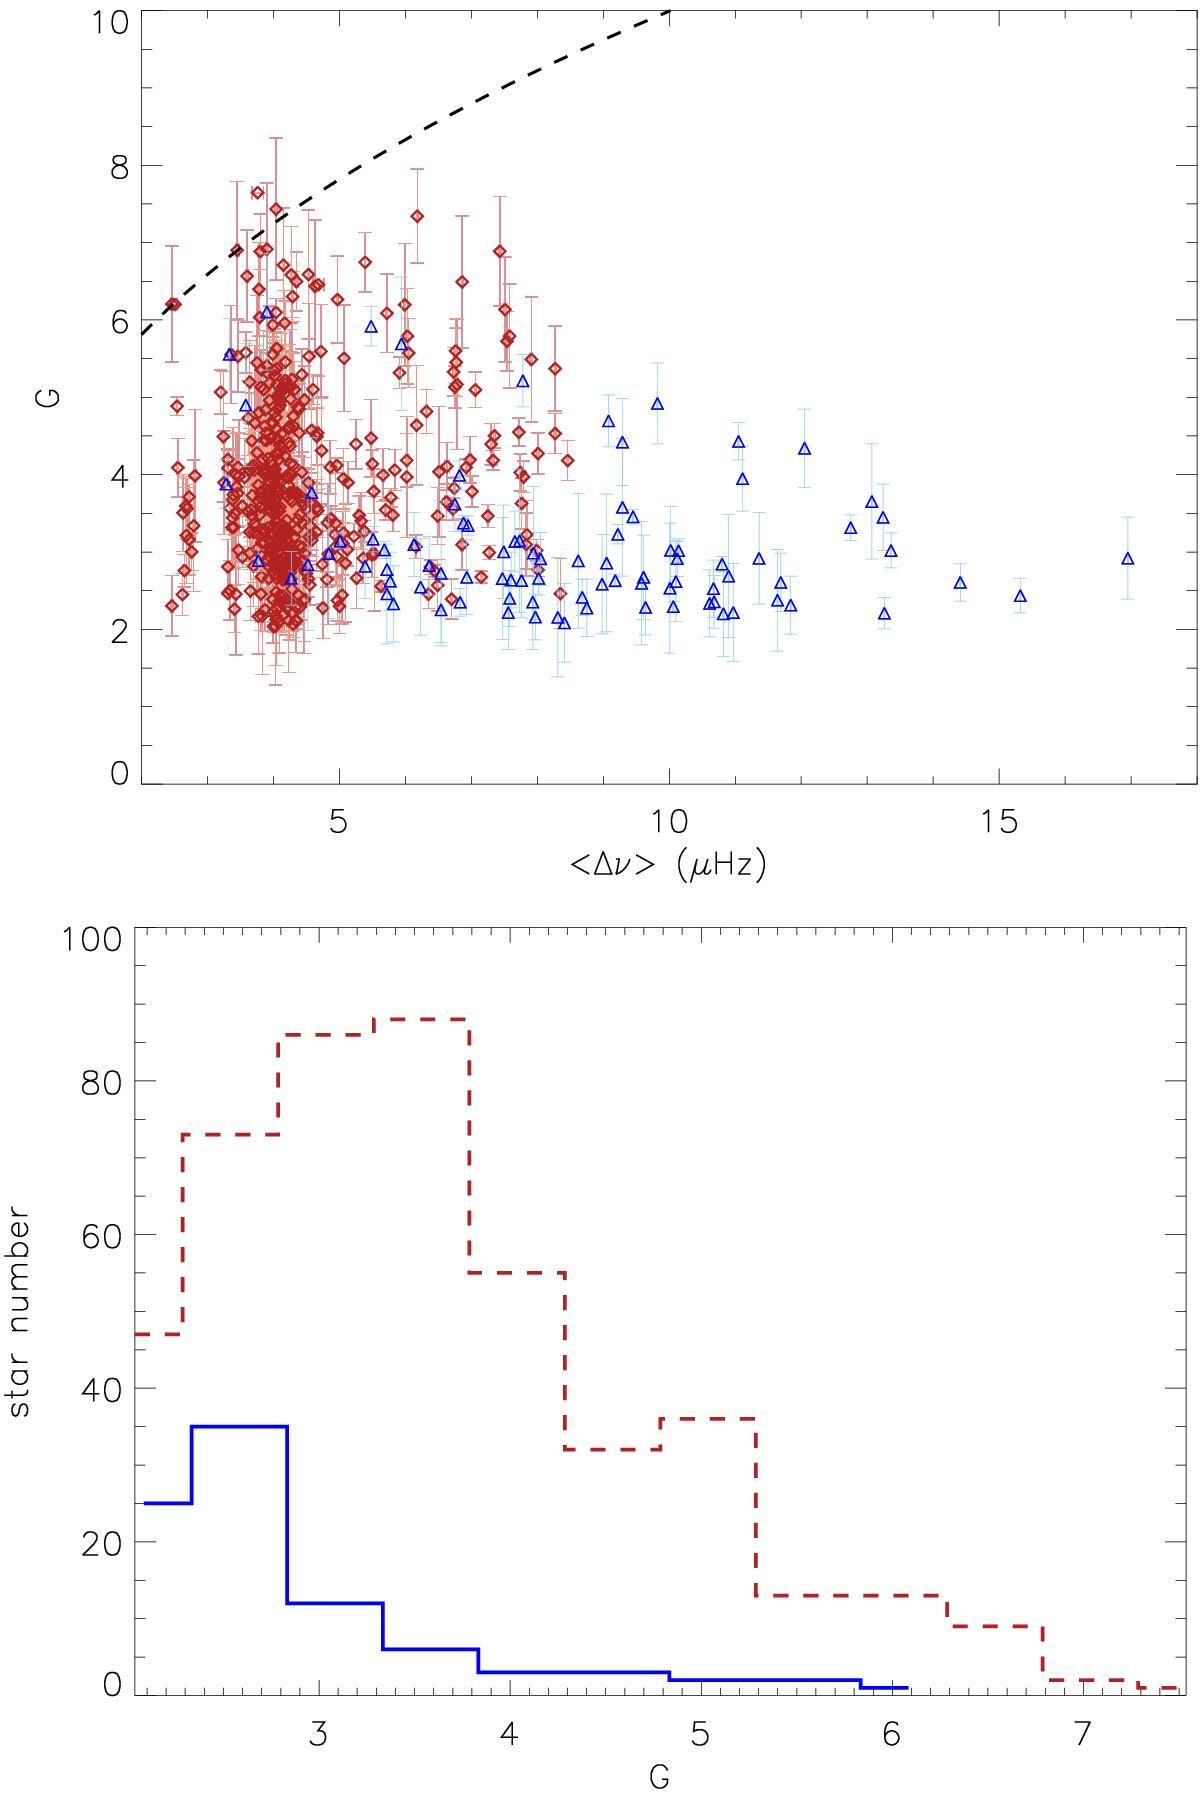
Top: dimensionless period ![]() of the modulation measured as a function of the large separation. Clump stars are indicated by red diamonds and RGB stars by blue triangles. Error bars correspond to the 1σ uncertainties. The dashed black line indicates the maximum number of radial modes observable in a red giant spectrum. Bottom: histogram of the dimensionless period
of the modulation measured as a function of the large separation. Clump stars are indicated by red diamonds and RGB stars by blue triangles. Error bars correspond to the 1σ uncertainties. The dashed black line indicates the maximum number of radial modes observable in a red giant spectrum. Bottom: histogram of the dimensionless period ![]() . Clump stars are indicated by the red dashed line and RGB stars by the blue line.
. Clump stars are indicated by the red dashed line and RGB stars by the blue line.
Current usage metrics show cumulative count of Article Views (full-text article views including HTML views, PDF and ePub downloads, according to the available data) and Abstracts Views on Vision4Press platform.
Data correspond to usage on the plateform after 2015. The current usage metrics is available 48-96 hours after online publication and is updated daily on week days.
Initial download of the metrics may take a while.