Fig. 2
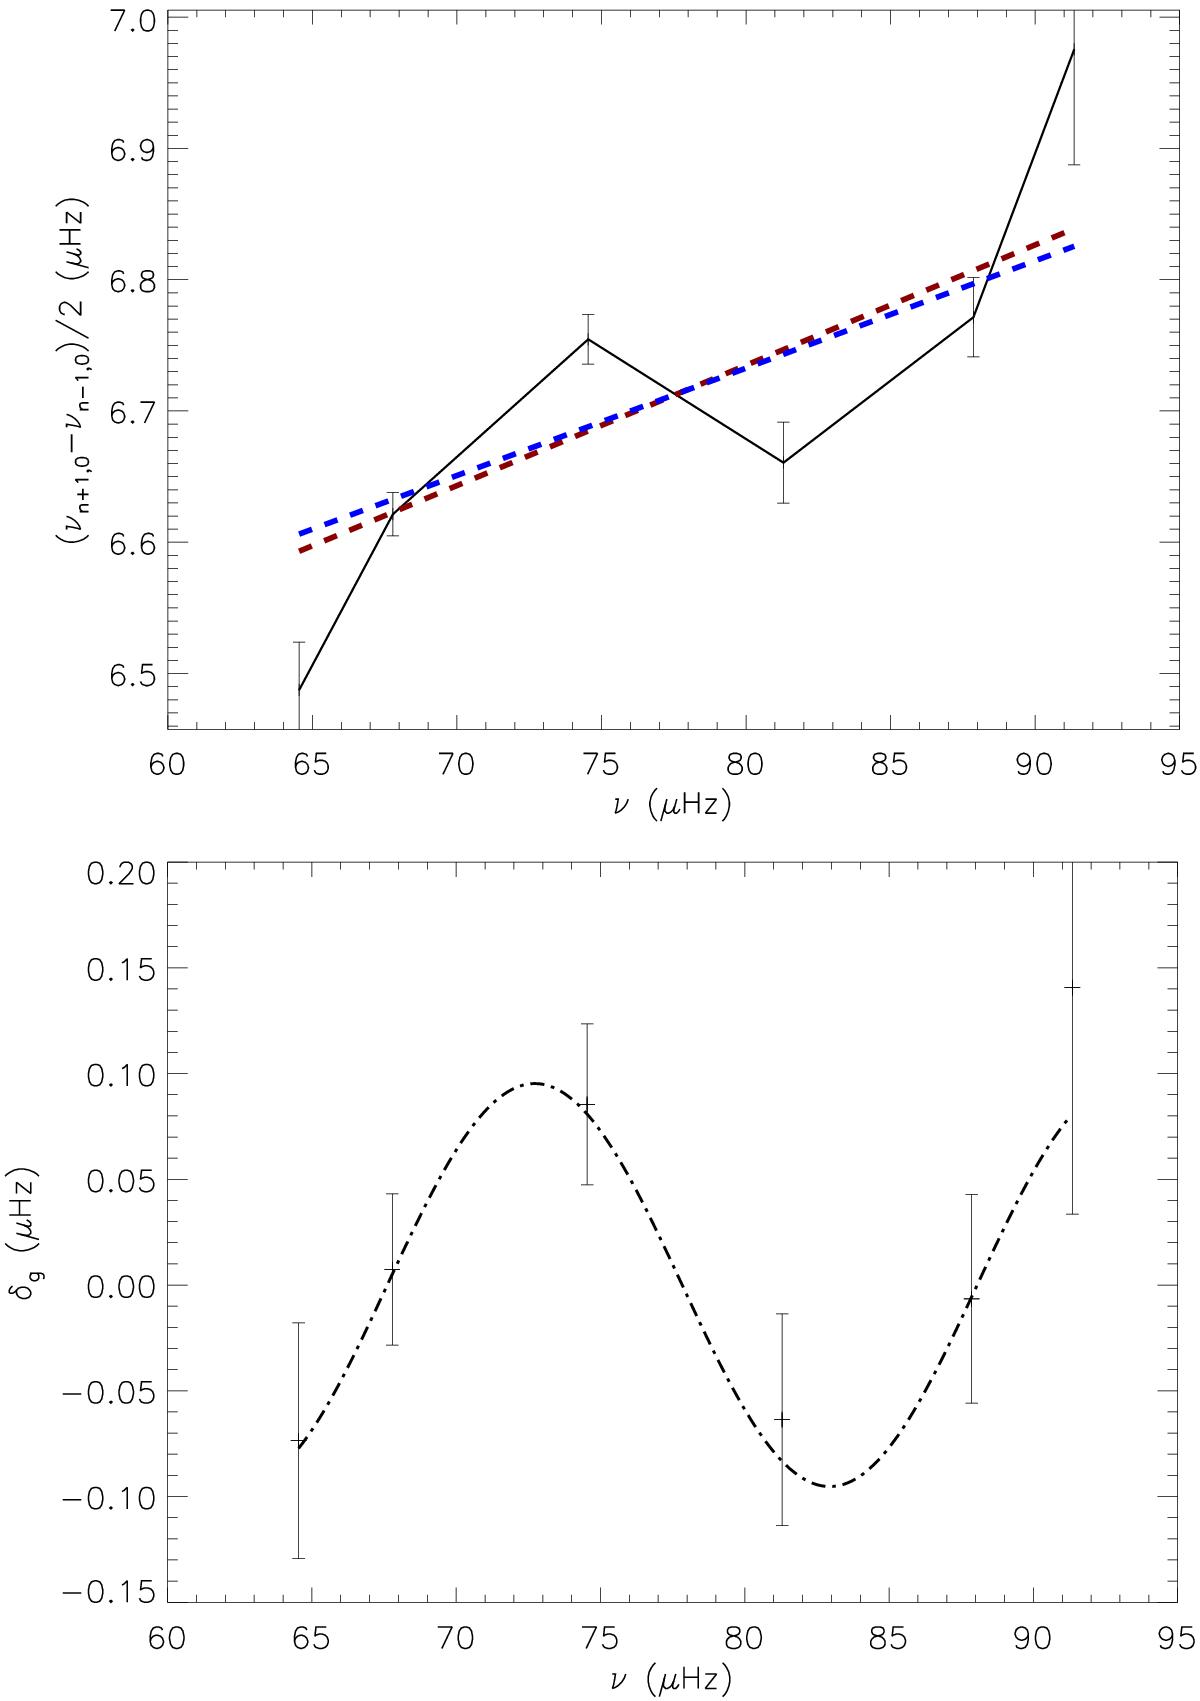
Top: variation of the large separation as a function of frequency for the star KIC1872166. Error bars correspond to the 1σ uncertainties. The general trend is due to the second-order term (the curvature) and the modulation is due to the presence of acoustic glitches. The red dashed line is a linear fit over the oscillations to estimate the curvature parameter. The blue dashed line is the value of the mean curvature given by Mosser et al. (2013)Bottom: variation of the large separation δn as a function of frequency after suppressing the curvature term. The dotted-dashed line shows a fit obtained for this star using Eq. (8).
Current usage metrics show cumulative count of Article Views (full-text article views including HTML views, PDF and ePub downloads, according to the available data) and Abstracts Views on Vision4Press platform.
Data correspond to usage on the plateform after 2015. The current usage metrics is available 48-96 hours after online publication and is updated daily on week days.
Initial download of the metrics may take a while.