Fig. 2
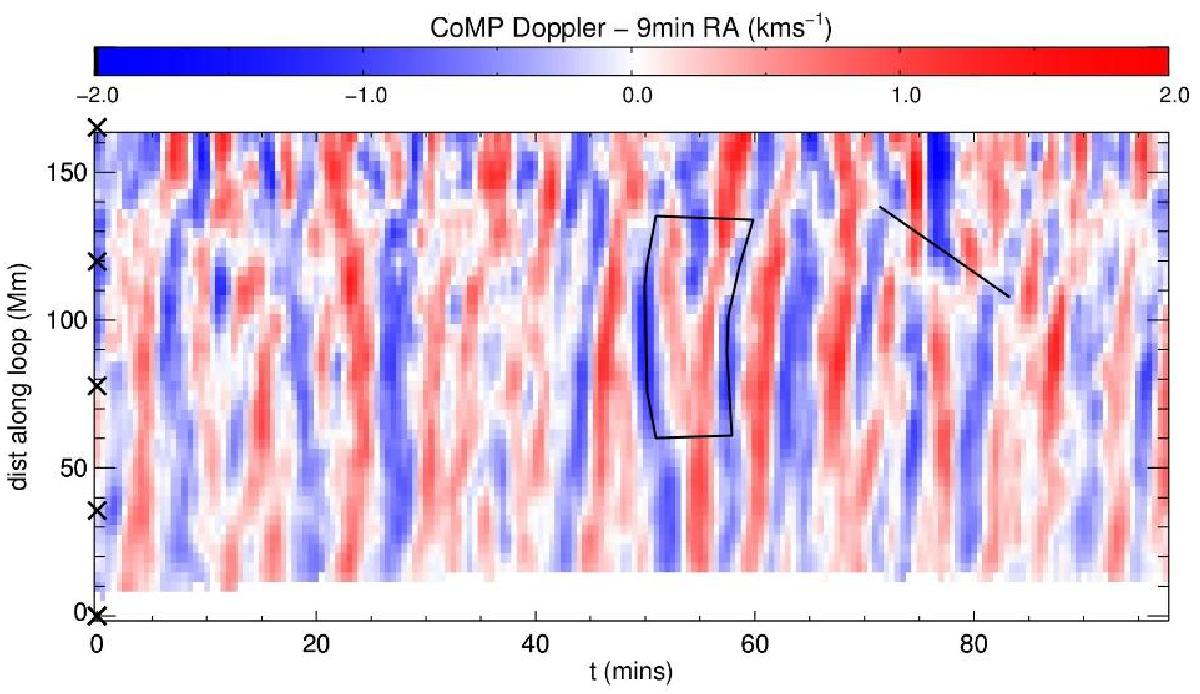
Observation of coronal waves in the Doppler velocity of a coronal emission line by COMP from Threlfall et al. (2013). The diagram has time in abscissas and the coordinate z, along the loop and parallel to the magnetic field, in ordinates. Among the many visible dislocations, two have been labeled. The closed curve (that could represent the monodromy) encloses an edge dislocation, while the straight segment follows a possible gliding dislocation.
Current usage metrics show cumulative count of Article Views (full-text article views including HTML views, PDF and ePub downloads, according to the available data) and Abstracts Views on Vision4Press platform.
Data correspond to usage on the plateform after 2015. The current usage metrics is available 48-96 hours after online publication and is updated daily on week days.
Initial download of the metrics may take a while.