Fig. 6
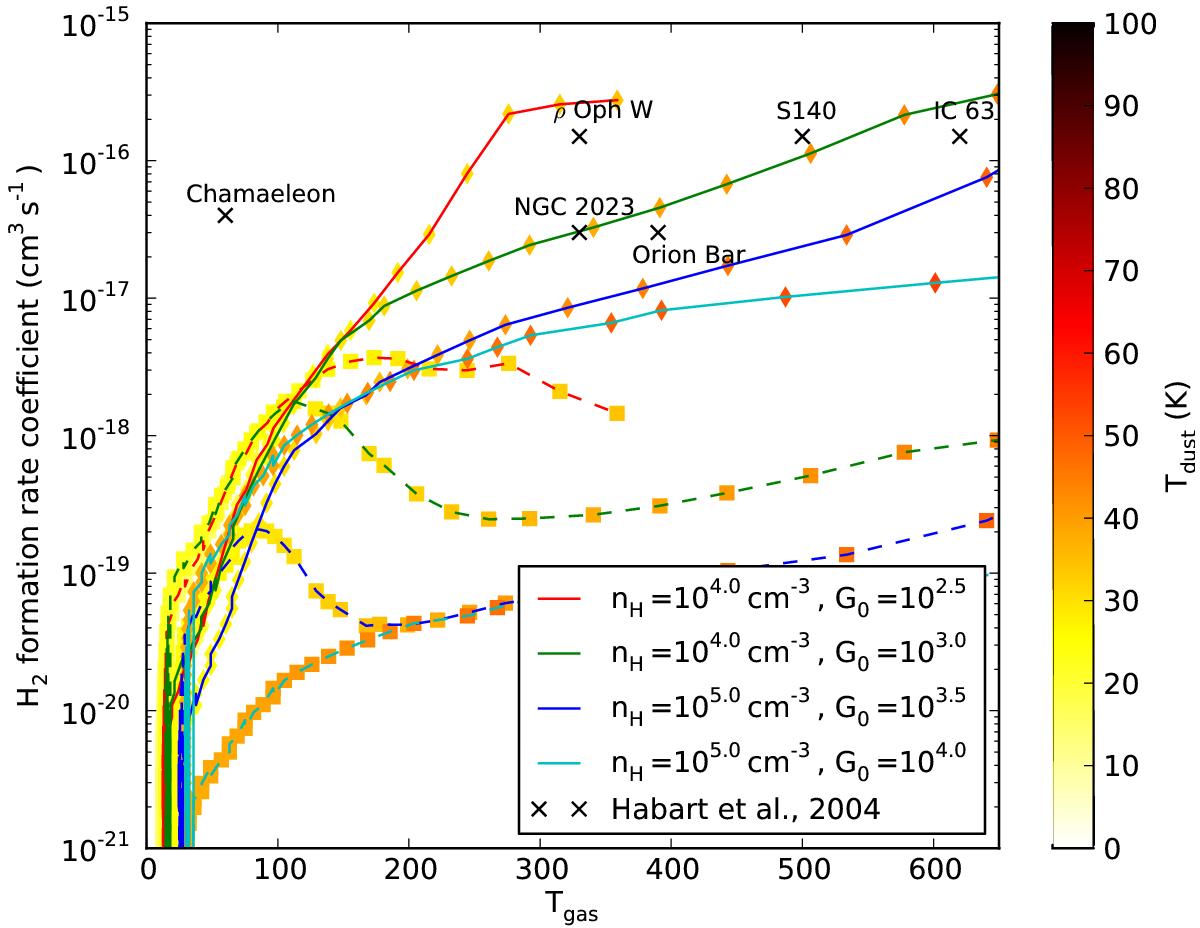
H2 formation rates on for different values of G0 and nH as a function of Tgas. Solid lines indicate H2 formation by PAHs and dashed lines represent dust grain H2 formation. For each datapoint, the color of the marker corresponds to the dust temperature of that datapoint. Both the gas and dust temperatures have been derived from the models in Hocuk & Spaans (2011). The black markers indicate the H2 formation rates reported by Habart et al. (2004) for different PDRs. These formation rates have been estimated using H2 line intensity ratios from the H2 fluorescent lines.
Current usage metrics show cumulative count of Article Views (full-text article views including HTML views, PDF and ePub downloads, according to the available data) and Abstracts Views on Vision4Press platform.
Data correspond to usage on the plateform after 2015. The current usage metrics is available 48-96 hours after online publication and is updated daily on week days.
Initial download of the metrics may take a while.