Fig. 8
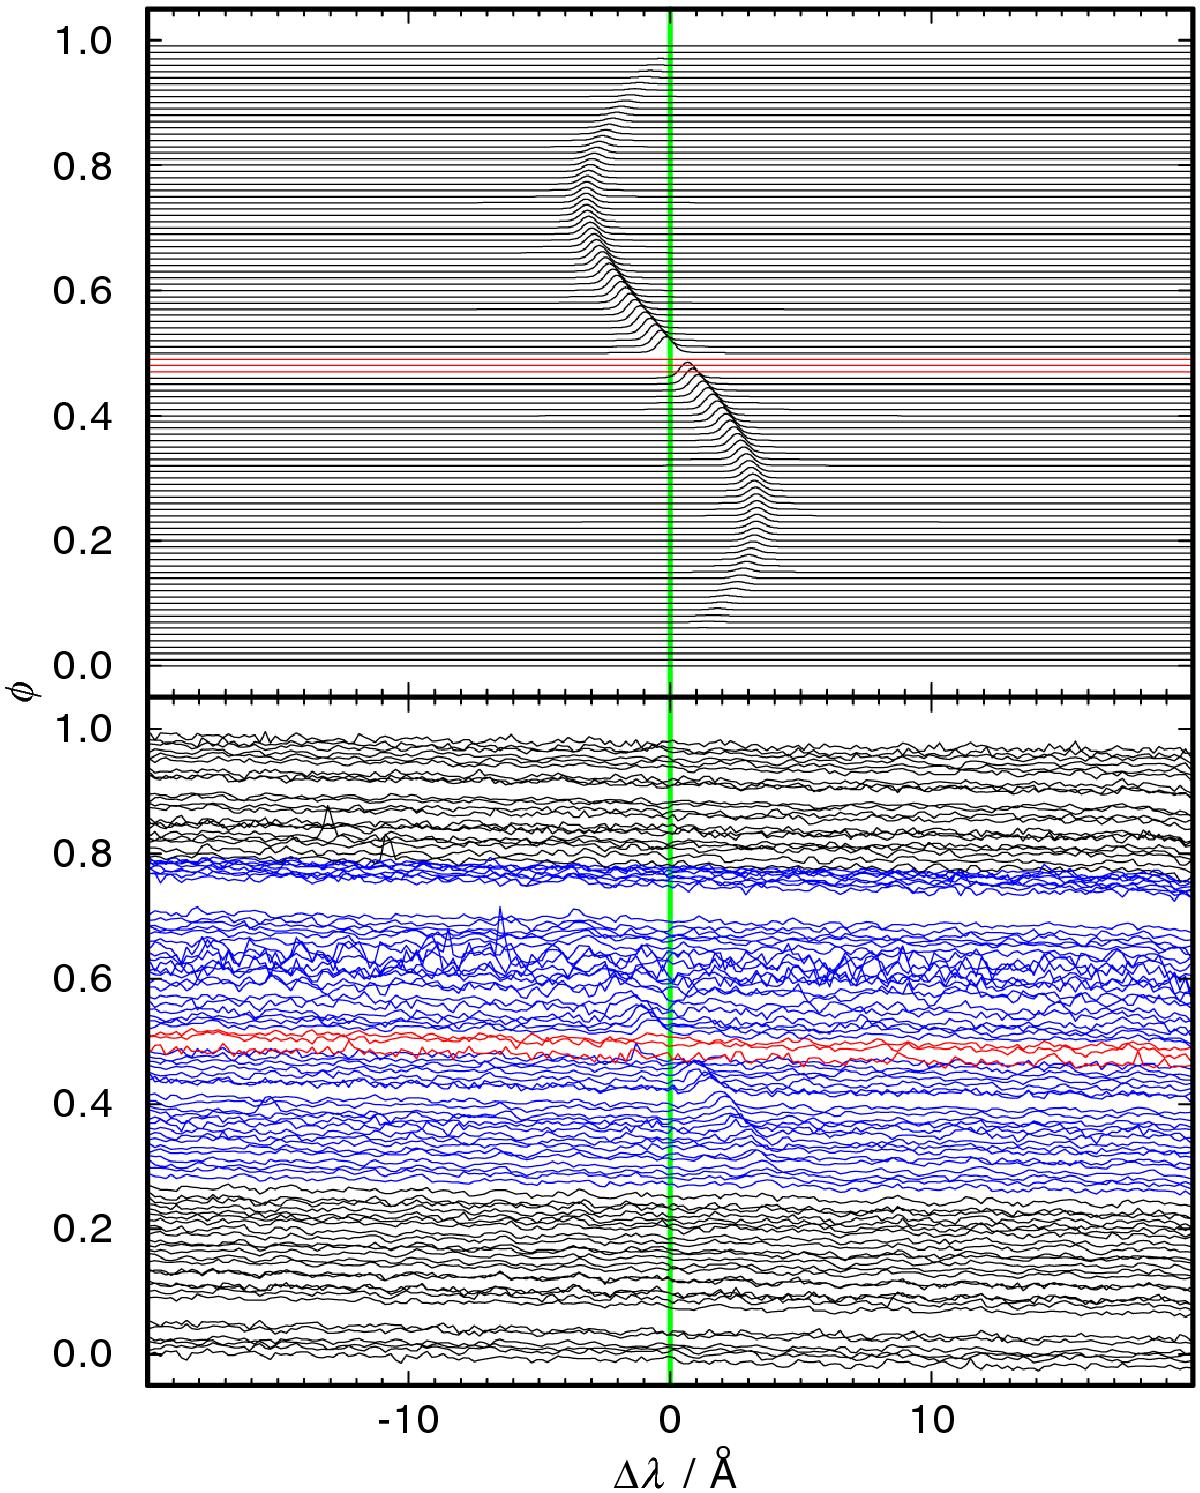
Top: C iiλ 4267.09 Å line in a simulation (with an assumed Ksec = 230 km s-1). φ is the orbital phase. The transit (φ = 0.0) and the occultation (φ = 0.5) of the secondary are simulated. Bottom: same line in our X-Shooter observations. In the online version, the red spectra show the occultation of the secondary. In the blue spectra, C iiλ 4267.09 Å is prominent. The vertical (green) bar indicates the rest wavelength of the line.
Current usage metrics show cumulative count of Article Views (full-text article views including HTML views, PDF and ePub downloads, according to the available data) and Abstracts Views on Vision4Press platform.
Data correspond to usage on the plateform after 2015. The current usage metrics is available 48-96 hours after online publication and is updated daily on week days.
Initial download of the metrics may take a while.