Fig. 7
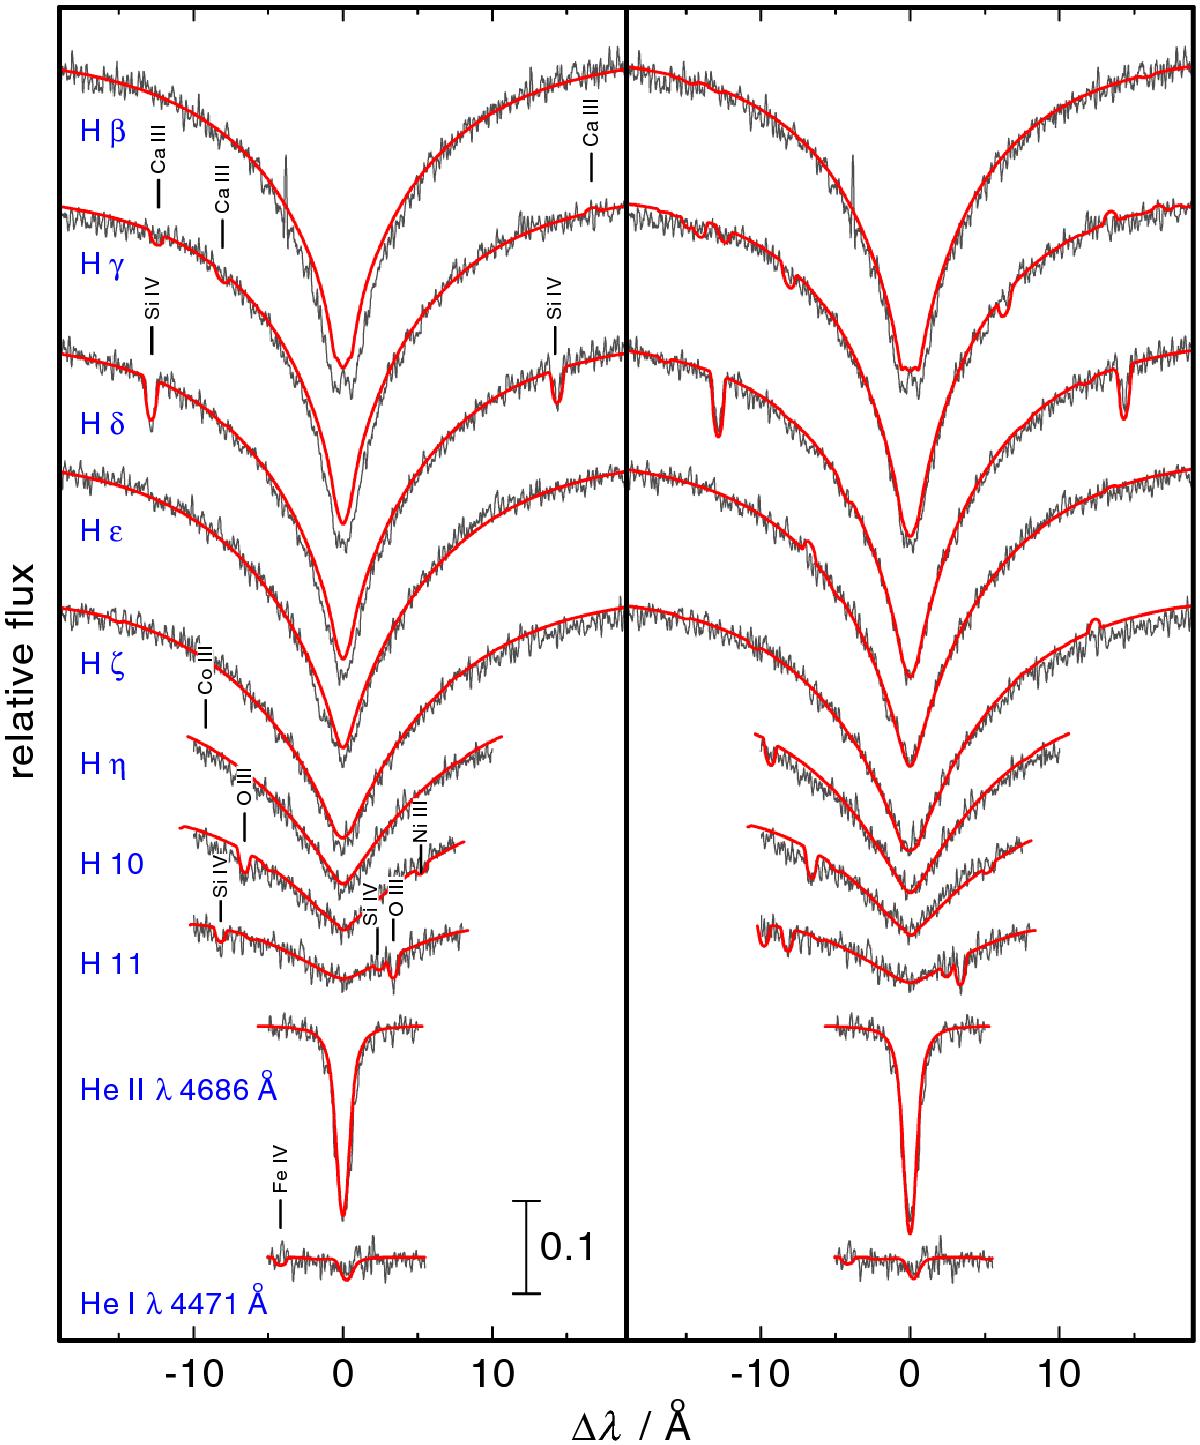
Comparison of synthetic profiles of H and He lines calculated from our models (, log g = 5.46) with our UVES observation (for clarity smoothed with a low-pass filter, Savitzky & Golay 1964). Left panel: abundances from Table 1, and Sc, Ti, V, Cr, Mn, and Co with solar abundances (Scott et al. 2015a). Right panel: similar model in the left panel, except the Sc, Ti, V, Cr, Mn, and Co abundances are artifically increased by a factor of 700. The vertical bar indicates 10% of the continuum flux.
Current usage metrics show cumulative count of Article Views (full-text article views including HTML views, PDF and ePub downloads, according to the available data) and Abstracts Views on Vision4Press platform.
Data correspond to usage on the plateform after 2015. The current usage metrics is available 48-96 hours after online publication and is updated daily on week days.
Initial download of the metrics may take a while.