Fig. 18
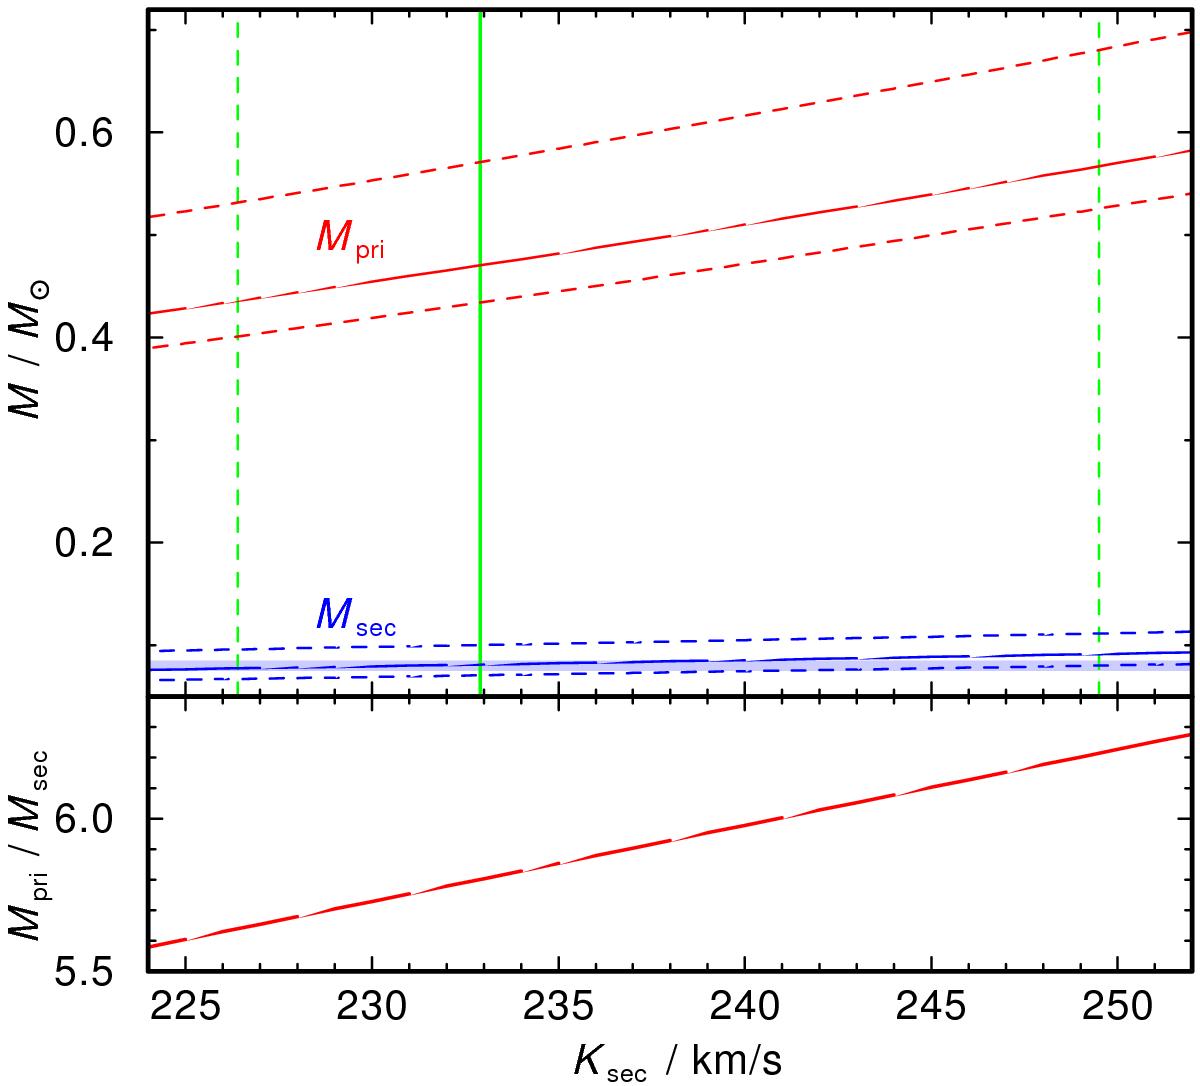
Top: dependency of the components’ masses (red: primary dashed lines show the error range, blue: secondary) on the orbital velocity of the secondary (for Kpri = 40.15 km s-1, Müller et al. 2010). The light blue horizontal region indicates the hydrogen-burning mass limit (Chabrier & Baraffe 1997). The green thick line shows our determination of Ksec = 232.9 km s-1. The error range is indicated by the green dashed lines.
Current usage metrics show cumulative count of Article Views (full-text article views including HTML views, PDF and ePub downloads, according to the available data) and Abstracts Views on Vision4Press platform.
Data correspond to usage on the plateform after 2015. The current usage metrics is available 48-96 hours after online publication and is updated daily on week days.
Initial download of the metrics may take a while.