Fig. 16
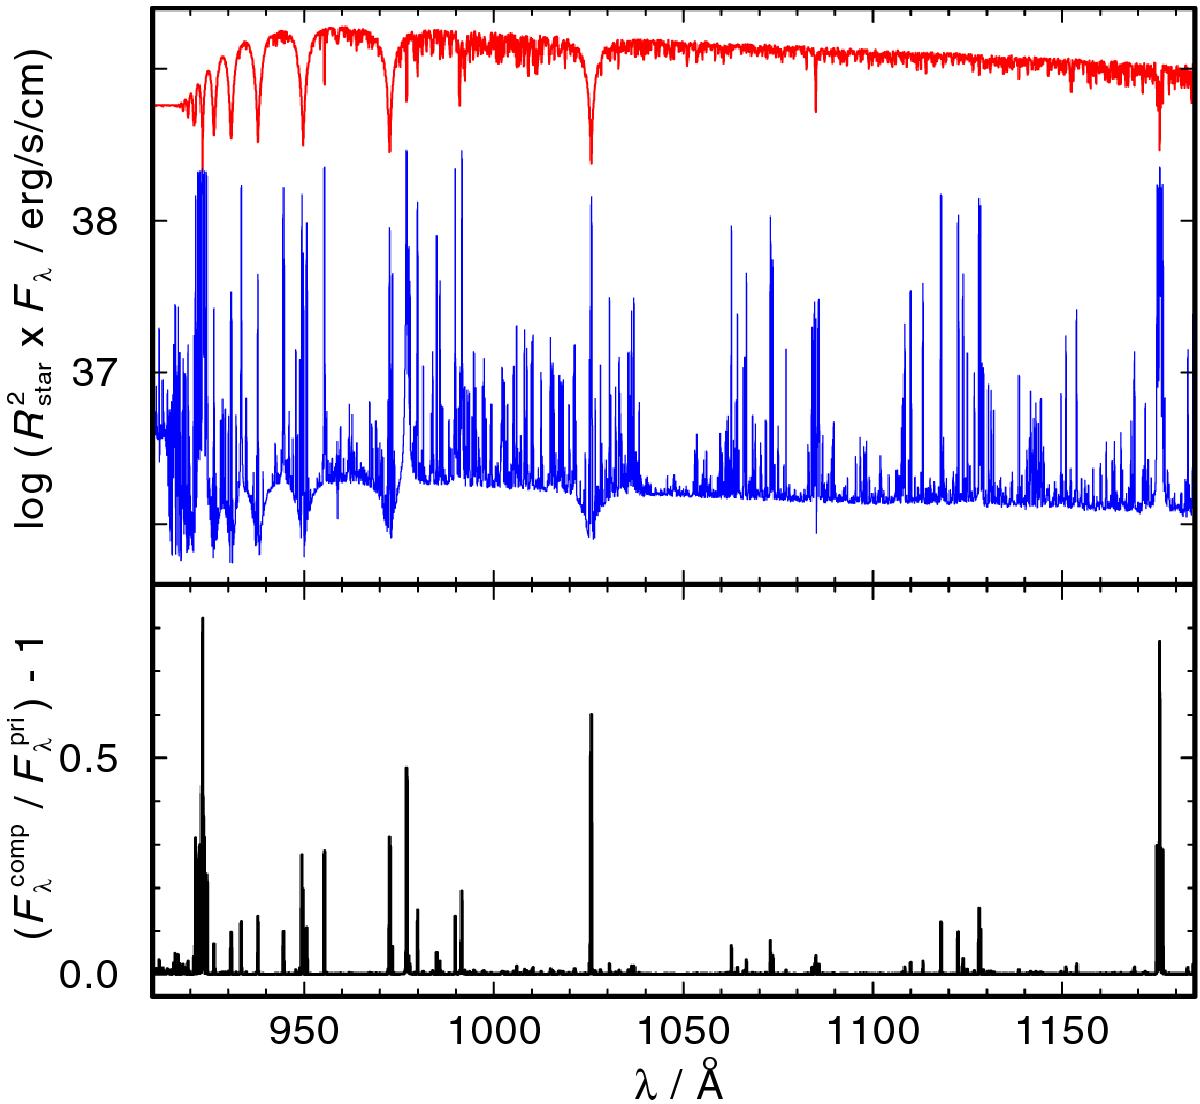
Top panel: contributions of the primary and the secondary to the composite flux of AA Dor in the FUSE wavelength range, convolved with rotational profiles using ![]() km s-1 (Rucinski 2009) and
km s-1 (Rucinski 2009) and ![]() km s-1 (calculated from Rsec = 0.1112, Sect. 6). The FUSE resolution was simulated by a subsequent convolution with a Gaussian (FWHM = 0.05 Å). Bottom panel: ratio of the composite flux to the primary’s flux.
km s-1 (calculated from Rsec = 0.1112, Sect. 6). The FUSE resolution was simulated by a subsequent convolution with a Gaussian (FWHM = 0.05 Å). Bottom panel: ratio of the composite flux to the primary’s flux.
Current usage metrics show cumulative count of Article Views (full-text article views including HTML views, PDF and ePub downloads, according to the available data) and Abstracts Views on Vision4Press platform.
Data correspond to usage on the plateform after 2015. The current usage metrics is available 48-96 hours after online publication and is updated daily on week days.
Initial download of the metrics may take a while.