Free Access
Fig. 4
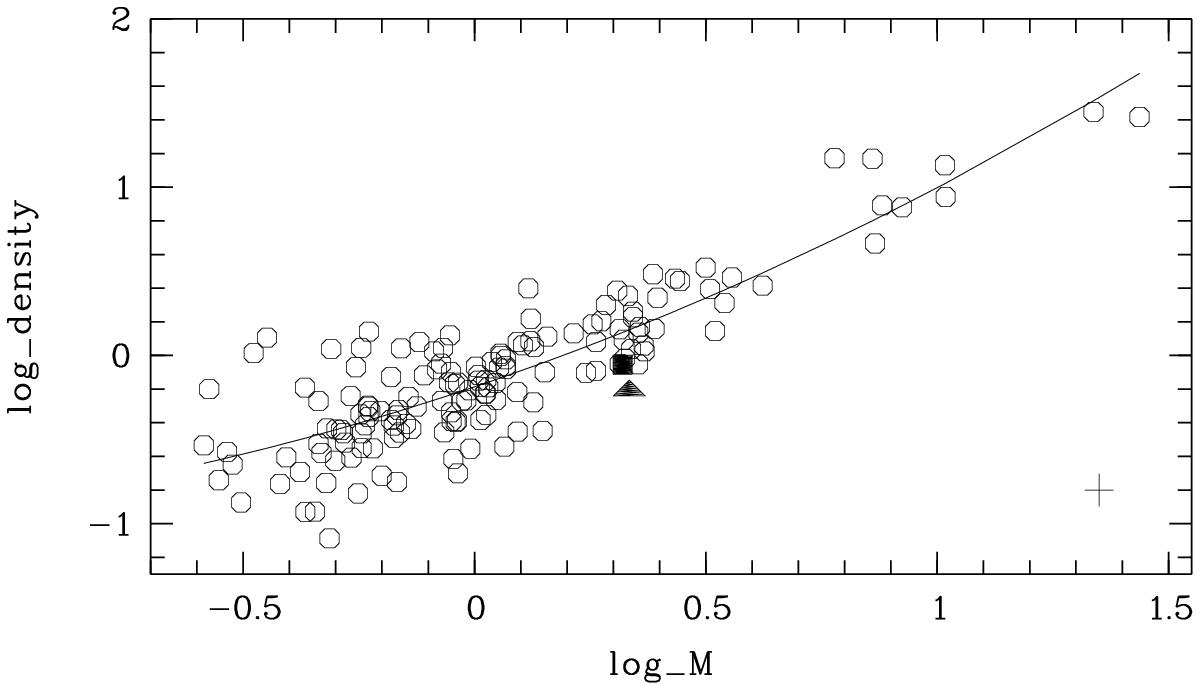
Logarithmic plot of the density of transiting exoplanets versus their mass. The solid line results from a polynomial fit. The positions of WASP-33b according to CC10 (square) and K13 (triangle) are labelled. The cross indicates the typical error bars.
Current usage metrics show cumulative count of Article Views (full-text article views including HTML views, PDF and ePub downloads, according to the available data) and Abstracts Views on Vision4Press platform.
Data correspond to usage on the plateform after 2015. The current usage metrics is available 48-96 hours after online publication and is updated daily on week days.
Initial download of the metrics may take a while.