Fig. 3
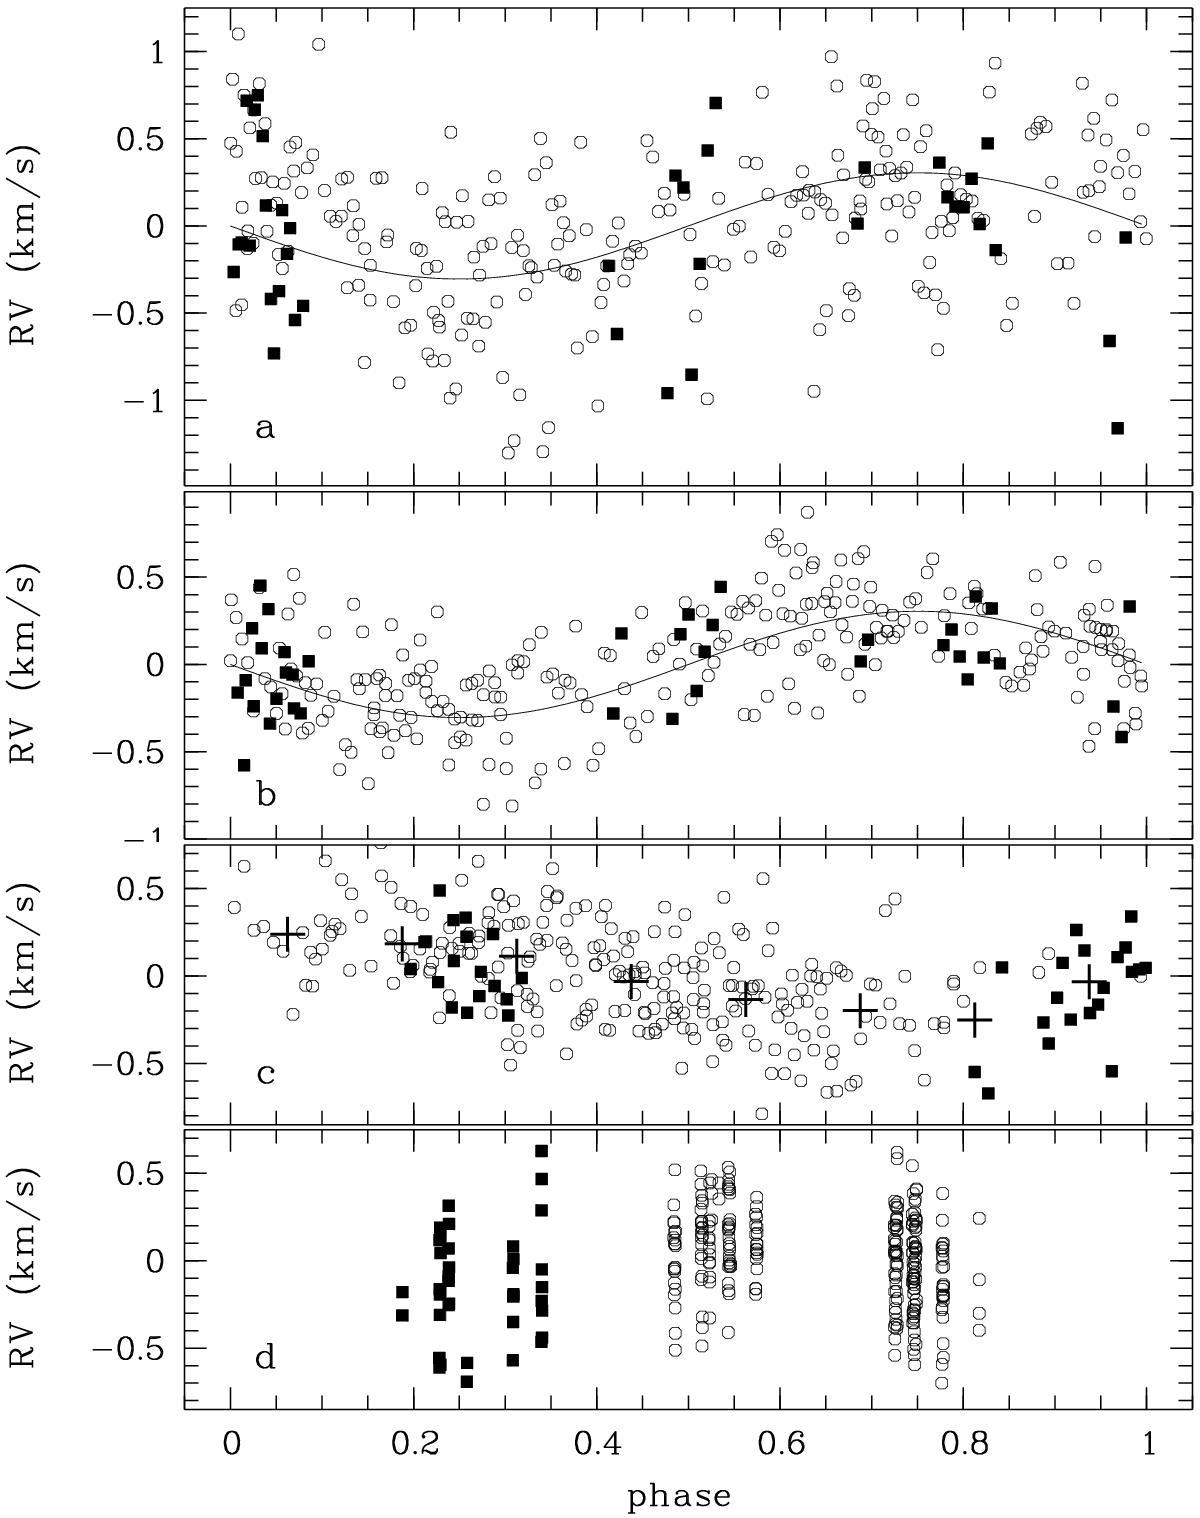
RVs from the spectra taken in 2013 (open circles) and 2015 (filled squares). a) Original RV data folded with f2; b) RVs after subtracting all frequency contributions but not f2, folded with f2; c) as b) but for f3, the solid lines show the best fitting orbital curve; d) as b) but for f1, the crosses represent phase-binned values.
Current usage metrics show cumulative count of Article Views (full-text article views including HTML views, PDF and ePub downloads, according to the available data) and Abstracts Views on Vision4Press platform.
Data correspond to usage on the plateform after 2015. The current usage metrics is available 48-96 hours after online publication and is updated daily on week days.
Initial download of the metrics may take a while.