| Issue |
A&A
Volume 578, June 2015
|
|
|---|---|---|
| Article Number | A91 | |
| Number of page(s) | 4 | |
| Section | Extragalactic astronomy | |
| DOI | https://doi.org/10.1051/0004-6361/201526038 | |
| Published online | 11 June 2015 | |
A study of purely astrometric selection of extragalactic point sources with Gaia
1
Dark Cosmology Centre, Niels Bohr Institute, Copenhagen
University,
Juliane Maries Vej 30,
2100
Copenhagen O,
Denmark
e-mail:
This email address is being protected from spambots. You need JavaScript enabled to view it.
2
Niels Bohr Institute, Copenhagen University,
Juliane Maries Vej 30,
2100
Copenhagen O,
Denmark
Received: 6 March 2015
Accepted: 11 May 2015
Abstract
Context. Selection of extragalactic point sources, e.g., quasi-stellar objects (QSOs), is often hampered by significant selection effects causing existing samples to have rather complex selection functions.
Aims. We explore whether a purely astrometric selection of extragalactic point sources, e.g., QSOs, is feasible with the ongoing Gaia mission. The idea has been discussed in the context of Gaia, but it is the first time quantified numbers have been given. This kind of selection would also be interesting as it would be unbiased in terms of colors of the targets and hence would allow selection also with colors in the stellar sequence.
Methods. We have analyzed a total of 18 representative regions of the sky using GUMS, the simulator prepared for ESAs Gaia mission, both in the range of 12 ≤ G ≤ 20 mag and 12 ≤ G ≤ 18 mag. For each region we determine the density of apparently stationary stellar sources, i.e., sources for which Gaia cannot measure a significant proper motion. The density is contrasted with the density of extragalactic point sources, e.g., QSOs, to establish in which celestial directions a pure astrometric selection is feasible.
Results. When targeting regions at galactic latitude | b | ≥ 30o the ratio of QSOs to apparently stationary stars is above 50% and when observing toward the poles, the fraction of QSOs goes up to about ~80%. We show that the proper motions from the proposed Gaia successor mission in about 20 years would dramatically improve these results at all latitudes. Detection of QSOs solely from zero proper motion, unbiased by any assumptions on spectra, might lead to the discovery of new types of QSOs or new classes of extragalactic point sources.
Key words: quasars: general / astrometry / proper motions
© ESO, 2015
1. Introduction
Since their discovery in the early 1960s (Schmidt 1963) numerous surveys for quasi-stellar objects (QSOs) have been carried out and the number of known QSOs now count hundreds of thousands. To have a complete understanding of supermassive black hole formation and evolution, it is desirable to select QSO samples in several different ways to be less constrained by selection effects.
The incompleteness of QSO samples based on selection by optical photometry has been studied intensively for many years (see, e.g., Richards et al. 2004, for a color selection of QSOs from the SDSS survey), and it is now well established that these samples miss a substantial number of, in particular, dust-reddened QSOs (see, e.g., Krawczyk et al. 2015, for a recent study).
To examine the feasibility of this approach, we first need to determine the contamination by the stars in our galaxy. To accomplish this we analyze how many stars will be selected by the zero proper motion criterion and toward which galactic coordinates the problem of stellar contamination will be most severe.
To describe this, we have structured the paper as follows. We start with a brief description of the Gaia mission and show the expected errors on proper motion from this mission and the usefulness of the soon to be obtained highly accurate astrometric measurements in Sect. 2. To get a hint about these future data, we have used extracts from a catalog of 1.6 billion stars generated for the Gaia mission, the so-called Gaia Universe Model Snapshot (GUMS), which is also briefly described in Sect. 2. In Sect. 3 and 4 we discuss the results of this analysis and thereby conclude on the feasibility of this new approach.
In the analysis we not only consider what we can accomplish with the Gaia mission alone, but also with proper motions having ten times smaller errors that from Gaia. This accuracy can be obtained by a combination of positions from Gaia and from another all-sky astrometric space mission in 20 years with similar errors on positions as Gaia; in fact, this would be the only feasible way to obtain this kind of accuracy. In the following, we refer to such a second mission as a “Gaia successor”.
2. Simulated Gaia data
The Gaia mission, launched by ESA in December 2013, is a very powerful astrometric mission that is scheduled to make a three-dimensional map of our galaxy, and provide an unprecedented measurement of positions, proper motions, and parallaxes to more than one billion stellar systems to a limit in the G-band of 20 mag during its five-six years mission lifetime (de Bruijne 2012).
2.1. GUMS
Gaia is expected to transmit close to 150 terabytes of raw data, therefore, preparation for acquiring this amount of data is essential (Luri et al. 2014). Hence, the Gaia Data Processing and Analysis Consortium (DPAC) has produced a set of simulators, including the Gaia Object Generator (GOG), which provides simulations of number counts and lists of observable objects and is designed to simulate catalog data (see, e.g., Robin et al. 2012).
A basic component of the Gaia simulator is its Universe Model (UM) from Robin et al. (2003, 2004). This model is capable of simulating almost every object down to Gaia’s limiting magnitude of G = 20 mag, both for galactic and extra-galactic objects (Luri et al. 2014). The Gaia simulator combined with the Universe model is then supposed to show a snapshot of the potentially observable objects by Gaia, thereby called the Gaia Universe Model Snapshot (GUMS). See especially Sect. 3 in Robin et al. (2012) for a full description of the stellar content.
We have used the extracts from this catalog of 1.6 billion stars, which have been generated by GUMS and can be obtained via the vizier website1. This has enabled us to derive precise numbers for the expected stellar contamination and the probability of separating QSOs and other extragalactic point sources from galactic sources.
2.2. Expected Gaia errors
We assumed the standard errors for a five year mission as expected before the launch of Gaia. These errors and the signal-to-noise ratio, S/N, are calculated as a function of the apparent magnitude G, which is approximately equal to the visual magnitude V. The following formulae are taken from de Bruijne (2012)2: ![Mathematical equation: \begin{eqnarray} &&z = 10^{(0.4\cdot(G-15))},~\mathrm{for}~G>12~{\rm mag}\nonumber\\ &&\sigma_{\pi}~[\mu\mathrm{as}] = \left({9.3+658.1\cdot z + 4.568\cdot z^2}\right)^{1/2}\nonumber\\ &&\qquad\ \qquad\times~\left[0.986 + (1-0.986)\cdot(V-I_{\rm C})\right],\nonumber\\ &&\sigma_{\mu}~[\mu\mathrm{as}~\mathrm{yr}^{-1}] = 0.526\cdot\sigma_{\pi}, ~~~ S/N = \frac{\mu}{\sigma_{\mu}}, \end{eqnarray}](/articles/aa/full_html/2015/06/aa26038-15/aa26038-15-eq9.png) (1)where G is the G-band magnitude, σπ denotes the error on the parallax measurement, σμ is the error on the proper motion, and for an unreddened G2V star, we can set (V − IC) = 0.75 (de Bruijne 2012). For G = 20 mag, this yields a lower limit in σμ of about 0.3 mas/yr, and for G = 18 mag, it is close to 0.1 mas/yr.
(1)where G is the G-band magnitude, σπ denotes the error on the parallax measurement, σμ is the error on the proper motion, and for an unreddened G2V star, we can set (V − IC) = 0.75 (de Bruijne 2012). For G = 20 mag, this yields a lower limit in σμ of about 0.3 mas/yr, and for G = 18 mag, it is close to 0.1 mas/yr.
3. Results
It is now possible to determine the expected contamination from stars with proper motions below the detection limit of Gaia.
In Fig. 1 we plotted the expected number of G ≤ 20 stars per square degree with proper motion less than μ as a function of μ in seven directions, of a total of 18 directions, as listed in Tables 1 to 4 of Sect. 3. For the plots of varying galactic latitude, b, we extracted a larger area of the sky of 3 × 3 or 5 × 5 deg2, and afterward divided the total number of stars by 9 or 25, respectively, to normalize the y-axis since the 1 × 1 deg2 area away from the galactic plane has a low density of stars.
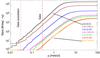 |
Fig. 1 Number of stars with a magnitude range in the G-band of 12 ≤ G ≤ 20 per square degree versus the cumulative distribution of each of their proper motion as seen on the sky, listed in seven directions as given by the galactic coordinates (l, b). The values (l, b) are listed at the right in the same sequence as the curves are seen. The red dashed line at μ = 0.3 mas/yr represents the estimated error of the proper motions from Gaia at G = 20 mag. The red dotted line at μ = 0.03 mas/yr represents the estimated error of the proper motions derived from the positions obtained from Gaia and the proposed Gaia successor mission, also at G = 20 mag. |
Results of data when only varying l, in the galactic plane for G ≤ 20 mag.
Results of data when only varying b, observing away from the galactic plane for G ≤ 20 mag, beginning at anticenter.
Results of data when only varying l, in the galactic plane for G ≤ 18 mag.
Results of data when only varying b, observing away from the galactic plane for G ≤ 18 mag, beginning at anticenter.
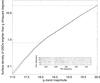 |
Fig. 2 Surface densities of QSOs at given magnitudes in the g-band from the BOSS catalog. The insert shows the celestial region we used to generate the plot, i.e., a region well away from the Galactic disk where the distribution is uniform. The two dotted lines show the QSO surface density for one square degree, which is found to be 19 and 0.76 when observing at a limited range of g = 20 and g = 18 mag, respectively. In the present context, we consider the bands g and G to be equivalent, although the effective wavelengths differ by about 100 nm. They vary greatly with spectral type, however, because both bands are very wide. |
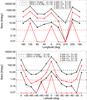 |
Fig. 3 Top panel: results of the analyzed stellar proper motions, when observing at b = 0 and varying galactic longitudes, with a S/N ≤ 5 for Gaia (marked with crosses) and a S/N ≤ 0.5 for a combination of Gaia and a proposed Gaia successor mission (marked with diamonds), both for G ≤ 20 mag and G ≤ 18 mag (shown with black and red lines, respectively). Bottom panel: results of the analyzed stellar proper motions, when observing at b = 0 and varying galactic latitudes, with a S/N ≤ 5 for Gaia and a S/N ≤ 0.5 for a combination of Gaia and a proposed Gaia successor mission, both for G ≤ 20 mag and G ≤ 18 mag (with same use of crosses, diamonds, black, and red lines as in the top panel). Black and red dashed lines represent the number of QSOs at G = 20 and G = 18 mag, respectively, from the BOSS catalog for comparison. |
To be conservative, we consider stars with proper motions measured with S/N ≤ 5 as possible contaminants. We also calculate the number of sources with S/N ≤ 0.5, which is the equivalent of S/N ≤ 5 for a data set based on Gaia plus a successor mission similar to Gaia operating about 20 years from now.
This kind of Gaia successor mission was proposed in May 2013 by Høg (2014a) as being crucial for the astrometric foundation of astrophysics and the proposal was further refined in Høg (2014b).
We show the results found when analyzing how many of the total number of stars in each direction in one square degree have S/N ≤ 5 and S/N ≤ 0.5, both for G ≤ 20 mag and G ≤ 18 mag. This is shown graphically in Fig. 3, whereas the listed values are shown in Tables 1–4. The points for G = 20 mag, shown with black points in Figs. 3, show that the number of contaminating stars is reduced by a factor 100 with the proposed Gaia successor mission, precisely what was expected with 10 times smaller errors of proper motions in the two celestial coordinates.
The surface density of known QSOs at each limiting magnitude from the BOSS catalog (see, e.g., Pâris et al. 2012, for the full catalog description) is plotted in Fig. 2. We plotted as a function of g-band magnitude as we do not have G-band magnitudes for the BOSS QSOs. The density of BOSS QSOs is shown as the two dotted lines (assuming g ≈ G) in Fig. 3 to indicate the relative frequency of known QSOs and galactic stars for each pointing direction.
It can be concluded from Fig. 3 that when observing with Gaia at G ≤ 20 mag, the probability that a point source with proper motion detected at less than 5σ is a QSO drops rapidly when observing below | b | = 30o. We have the highest probability to select a QSO with Gaia at S/N ≤ 5 for G ≤ 20 at (l,b) = (180,60) where, according to Table 2:  (2)The probability is just above 50% at | b | = 30o, which means that this way of selecting extragalactic point sources clearly is feasible. Also shown in Fig. 3 is that with a Gaia successor mission 20 years after the current Gaia mission the contamination from apparently stationary stars essentially would be eliminated.
When restricting the analysis to a brighter limiting magnitude of G ≤ 18 instead, the contamination from apparently stationary stars is slightly higher. The first line of Tables 1 to 4 denotes the total number of stars per square degree in the listed direction. The next three lines show the number of stars with values lower than μ ≤ 0.3 mas/yr, S/N ≤ 5 and S/N ≤ 0.5, respectively. The final two lines shows the QSO fraction, when observing point sources in the limit of S/N = 5 and S/N = 0.5, respectively. The numbers in last line of Table 1 demonstrate that QSOs can be extracted with high probability at the longitudes 90, 270, and 315 degrees, even in the galactic plane, but these numbers do not take interstellar absorption into account.
4. Discussion and conclusions
We used the object simulator prepared for the Gaia mission, GUMS, to determine the expected contamination from galactic stars in a search for extragalactic point sources based on astrometric measurements from Gaia.
By analyzing GUMS, we determine the frequency of selecting a QSO based on the density inferred from BOSS against the background of apparently stationary stars. This provides a conservative estimate of the relative number of QSOs and apparent stationary stars, as the BOSS survey does not contain all QSOs down to the flux limit of the survey (examples of missed QSOs can be found in Fynbo et al. 2013, Krogager et al. 2015).
At | b | > 30o the ratio of QSOs relative to stars is above 50% when observing down to G ≤ 20 mag. When decreasing the magnitude range to G ≤ 18 mag a lower number of stellar contamination is obtained but the relative QSO surface density in that magnitude range decreases as well, yielding a sightly higher level of stellar contamination. When observing below | b | = 30o, close to the galactic plane, the contamination increases rapidly.
With a Gaia successor mission, i.e., a mission similar to Gaia launched in about 20 years from now, the standard error on the measurement of the proper motions would decrease by
about a factor of ten, resulting in 100 times improvement in the ability to select extragalactic point sources against the background of apparently stationary stars.
Since the method we analyze here is unbiased in terms of color, this method has the potential to discover new, exotic types of QSOs and even in principle new classes of extragalactic point sources. Also, this method would allow the construction of an unbiased QSO sample limited only in its flux limit. This would be very valuable for adressing several issues, e.g., the true metallicity distribution of foreground damped Lyman-α absorber galaxies (e.g., Fall & Pei 1993) or the redshift distribution of broad absorption line QSOs (Saturni et al. 2015).
We also note that the astrometric information from Gaia will be very useful to remove contaminating stellar sources from other more targeted searches for red QSOs. Often such contaminating sources are M-dwarfs, which due to their small distances should have significant proper motions.
We assumed that QSOs are point sources, but we are aware that this is not always the case. Variability of a QSO with changing centres could introduce observed proper motions. We are aware that proper motions of quasars may be significant. In the catalog by Titov et al. (2011) with 555 radio sources, the motions are typically 0.1 mas/yr and some even 1 mas/yr, but the 40 most frequently observed sources shown in Fig. 2 of the paper all have much smaller motions of less than 0.025 mas/yr. One can argue that optical QSOs should be more stable than radio sources, more compact, etc., but we do not know for sure until Gaia data become available.
Acknowledgments
The data from GUMS, the Gaia Universe Model Snapshot, were aquired with kind help from Carine Babusiaux and they were used for simulation of observations as expected from Gaia. We thank Coryn Bailer-Jones, Sergei Klioner, and Palle Møller for helpful comments. The Dark Cosmology Centre is funded by the DNRF. The research leading to these results has received funding from the European Research Council under the European Union’s Seventh Framework Program (FP7/2007-2013)/ERC Grant agreement No. EGGS-278202.
References
- de Bruijne, J. H. J. 2012, Ap&SS, 341, 31 [NASA ADS] [CrossRef] [Google Scholar]
- Fall, S. M., & Pei, Y. C. 1993, ApJ, 402, 479 [NASA ADS] [CrossRef] [Google Scholar]
- Fynbo, J. P. U., Krogager, J.-K., Venemans, B., et al. 2013, ApJS, 204, 6 [NASA ADS] [CrossRef] [Google Scholar]
- Høg, E. 2014a, ArXiv e-prints [arXiv:1408.3299] [Google Scholar]
- Høg, E. 2014b, ArXiv e-prints [arXiv:1408.2122] [Google Scholar]
- Krawczyk, C. M., Richards, G. T., Gallagher, S. C., et al. 2015, AJ, 149, 203 [NASA ADS] [CrossRef] [Google Scholar]
- Krogager, J.-K., Geier, S., Fynbo, J. P. U., et al. 2015, ApJS, 217, 5 [NASA ADS] [CrossRef] [Google Scholar]
- Luri, X., Palmer, M., Arenou, F., et al. 2014, A&A, 566, A119 [NASA ADS] [CrossRef] [EDP Sciences] [Google Scholar]
- Pâris, I., Petitjean, P., Aubourg, É., et al. 2012, A&A, 548, A66 [NASA ADS] [CrossRef] [EDP Sciences] [Google Scholar]
- Richards, G. T., Nichol, R. C., Gray, A. G., et al. 2004, ApJS, 155, 257 [NASA ADS] [CrossRef] [Google Scholar]
- Robin, A. C., Reylé, C., Derrière, S., & Picaud, S. 2003, A&A, 409, 523 [NASA ADS] [CrossRef] [EDP Sciences] [Google Scholar]
- Robin, A. C., Reylé, C., Derrière, S., & Picaud, S. 2004, A&A, 416, 157 [NASA ADS] [CrossRef] [EDP Sciences] [Google Scholar]
- Robin, A. C., Luri, X., Reylé, C., et al. 2012, A&A, 543, A100 [NASA ADS] [CrossRef] [EDP Sciences] [Google Scholar]
- Saturni, F. G., Møller, P., Freudling, W., et al. 2015, MNRAS, submitted [Google Scholar]
- Schmidt, M. 1963, Nature, 197, 1040 [NASA ADS] [CrossRef] [Google Scholar]
- Titov, O., Lambert, S. B., & Gontier, A.-M. 2011, A&A, 529, A91 [NASA ADS] [CrossRef] [EDP Sciences] [Google Scholar]
All Tables
Results of data when only varying b, observing away from the galactic plane for G ≤ 20 mag, beginning at anticenter.
Results of data when only varying b, observing away from the galactic plane for G ≤ 18 mag, beginning at anticenter.
All Figures
|
Fig. 1 Number of stars with a magnitude range in the G-band of 12 ≤ G ≤ 20 per square degree versus the cumulative distribution of each of their proper motion as seen on the sky, listed in seven directions as given by the galactic coordinates (l, b). The values (l, b) are listed at the right in the same sequence as the curves are seen. The red dashed line at μ = 0.3 mas/yr represents the estimated error of the proper motions from Gaia at G = 20 mag. The red dotted line at μ = 0.03 mas/yr represents the estimated error of the proper motions derived from the positions obtained from Gaia and the proposed Gaia successor mission, also at G = 20 mag. |
| In the text | |
|
Fig. 2 Surface densities of QSOs at given magnitudes in the g-band from the BOSS catalog. The insert shows the celestial region we used to generate the plot, i.e., a region well away from the Galactic disk where the distribution is uniform. The two dotted lines show the QSO surface density for one square degree, which is found to be 19 and 0.76 when observing at a limited range of g = 20 and g = 18 mag, respectively. In the present context, we consider the bands g and G to be equivalent, although the effective wavelengths differ by about 100 nm. They vary greatly with spectral type, however, because both bands are very wide. |
| In the text | |
|
Fig. 3 Top panel: results of the analyzed stellar proper motions, when observing at b = 0 and varying galactic longitudes, with a S/N ≤ 5 for Gaia (marked with crosses) and a S/N ≤ 0.5 for a combination of Gaia and a proposed Gaia successor mission (marked with diamonds), both for G ≤ 20 mag and G ≤ 18 mag (shown with black and red lines, respectively). Bottom panel: results of the analyzed stellar proper motions, when observing at b = 0 and varying galactic latitudes, with a S/N ≤ 5 for Gaia and a S/N ≤ 0.5 for a combination of Gaia and a proposed Gaia successor mission, both for G ≤ 20 mag and G ≤ 18 mag (with same use of crosses, diamonds, black, and red lines as in the top panel). Black and red dashed lines represent the number of QSOs at G = 20 and G = 18 mag, respectively, from the BOSS catalog for comparison. |
| In the text | |
Current usage metrics show cumulative count of Article Views (full-text article views including HTML views, PDF and ePub downloads, according to the available data) and Abstracts Views on Vision4Press platform.
Data correspond to usage on the plateform after 2015. The current usage metrics is available 48-96 hours after online publication and is updated daily on week days.
Initial download of the metrics may take a while.