Fig. 1
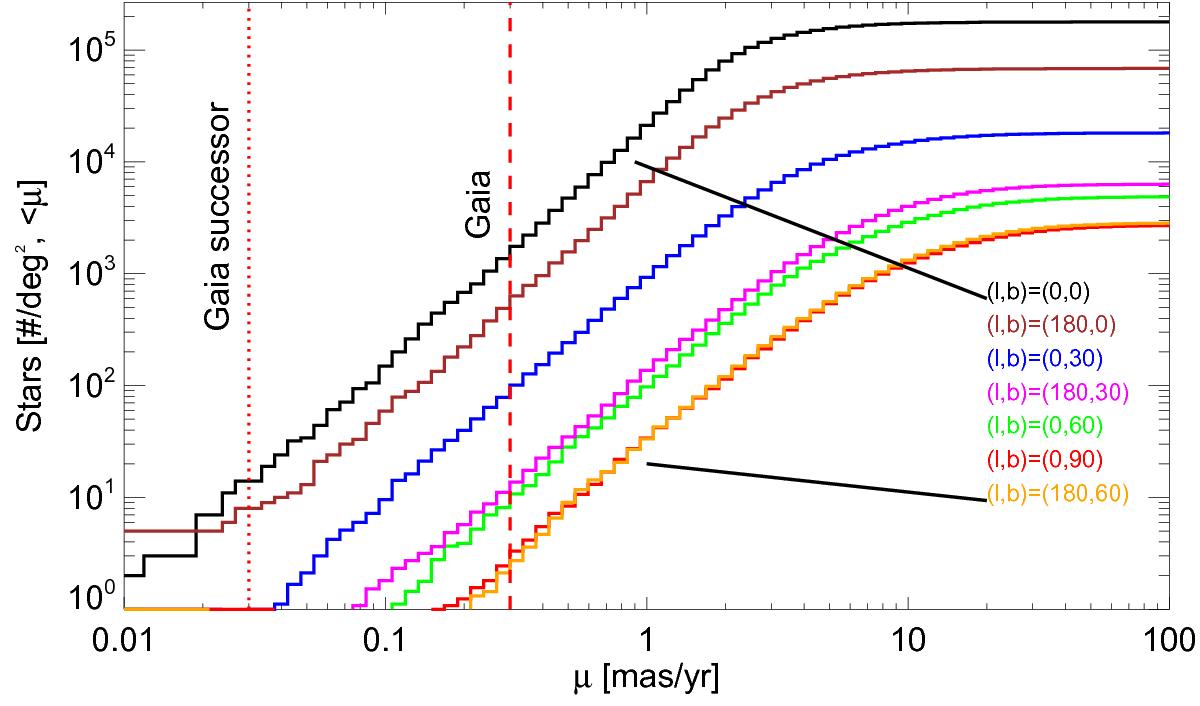
Number of stars with a magnitude range in the G-band of 12 ≤ G ≤ 20 per square degree versus the cumulative distribution of each of their proper motion as seen on the sky, listed in seven directions as given by the galactic coordinates (l, b). The values (l, b) are listed at the right in the same sequence as the curves are seen. The red dashed line at μ = 0.3 mas/yr represents the estimated error of the proper motions from Gaia at G = 20 mag. The red dotted line at μ = 0.03 mas/yr represents the estimated error of the proper motions derived from the positions obtained from Gaia and the proposed Gaia successor mission, also at G = 20 mag.
Current usage metrics show cumulative count of Article Views (full-text article views including HTML views, PDF and ePub downloads, according to the available data) and Abstracts Views on Vision4Press platform.
Data correspond to usage on the plateform after 2015. The current usage metrics is available 48-96 hours after online publication and is updated daily on week days.
Initial download of the metrics may take a while.