Fig. 1
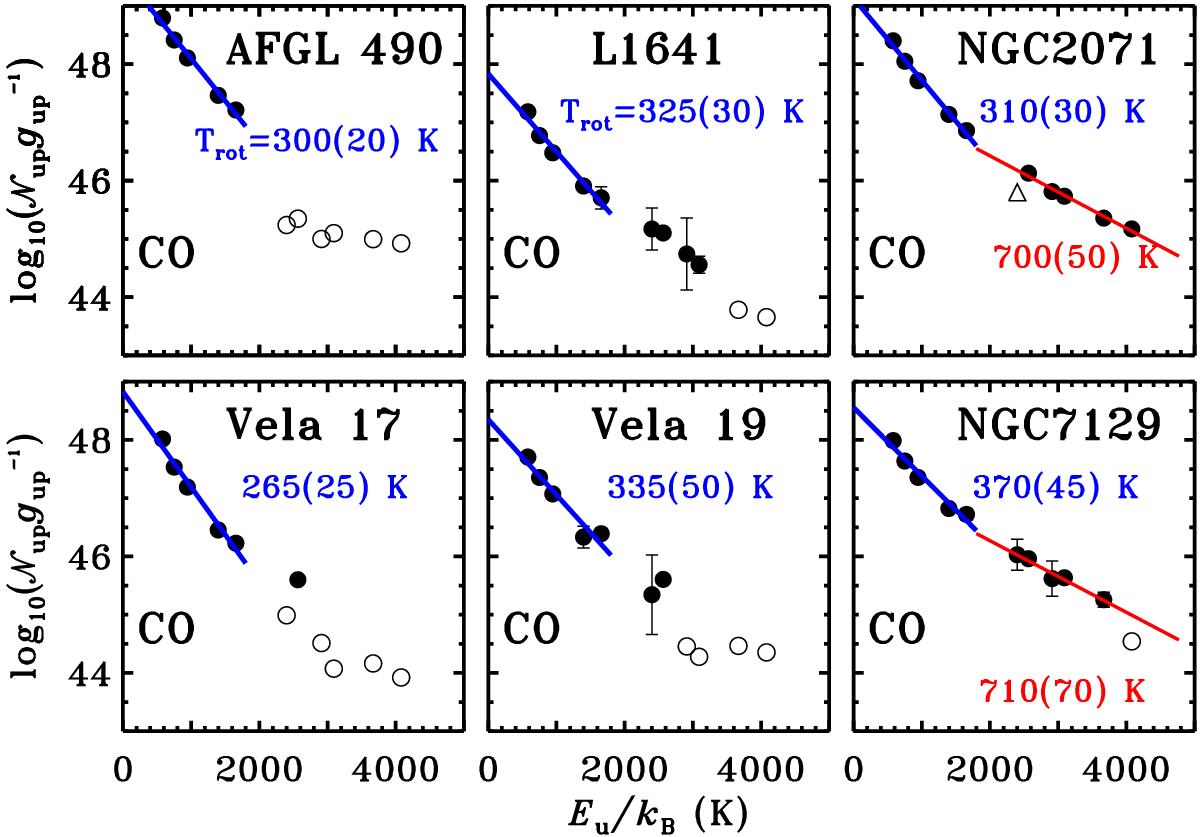
Rotational diagrams of CO. The base-10 logarithm of the number of emitting molecules from the upper level, ![]() , divided by the degeneracy of the level, gup, is shown as a function of energy of the upper level in kelvins, Eup. Detections are shown as filled circles, whereas three-sigma upper limits are shown as empty circles. The empty upper triangle corresponds to the line flux calculated using a smaller area on the map than the rest of the lines. Blue lines show linear fits to the data and the corresponding rotational temperatures. Errors associated with the least-square linear fit are shown in brackets.
, divided by the degeneracy of the level, gup, is shown as a function of energy of the upper level in kelvins, Eup. Detections are shown as filled circles, whereas three-sigma upper limits are shown as empty circles. The empty upper triangle corresponds to the line flux calculated using a smaller area on the map than the rest of the lines. Blue lines show linear fits to the data and the corresponding rotational temperatures. Errors associated with the least-square linear fit are shown in brackets.
Current usage metrics show cumulative count of Article Views (full-text article views including HTML views, PDF and ePub downloads, according to the available data) and Abstracts Views on Vision4Press platform.
Data correspond to usage on the plateform after 2015. The current usage metrics is available 48-96 hours after online publication and is updated daily on week days.
Initial download of the metrics may take a while.