Fig. 4
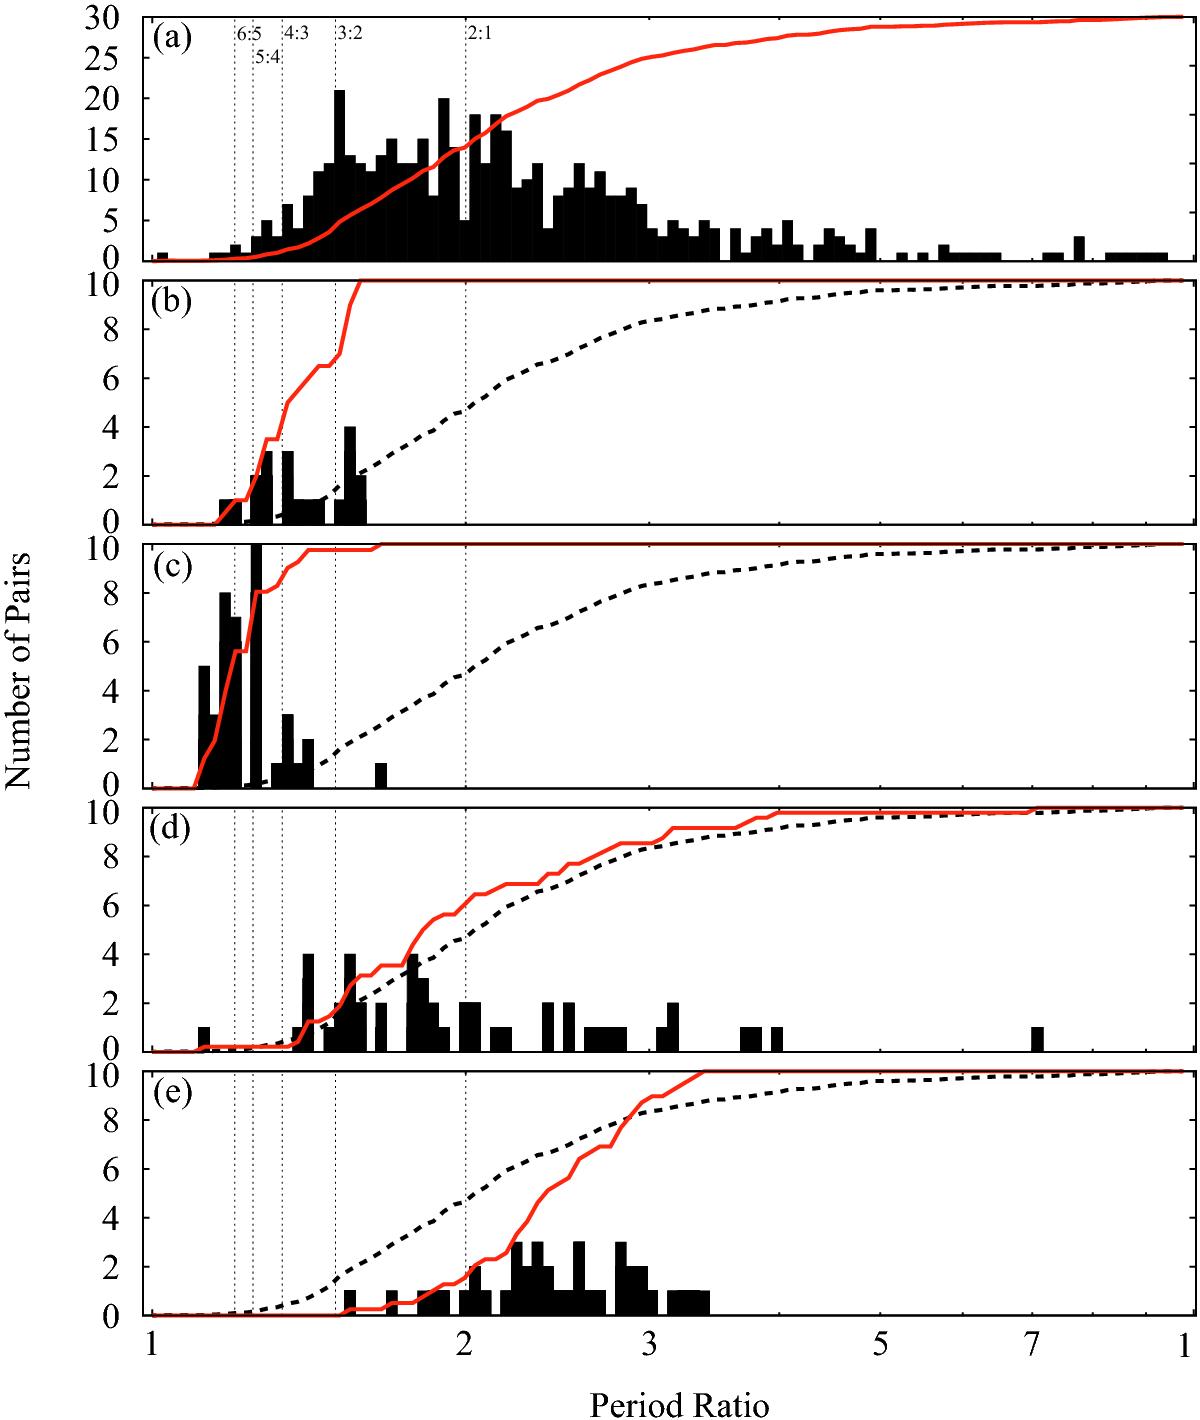
Comparison of the distributions of period ratios of adjacent pairs of planets for a) observation and b)−d) simulations. The distribution of period ratios is presented as a histogram (see the left y-axis) and as a cumulative distribution (see the right y-axis). Panels b)−e) show the results of Models 1, 2, 3, and 4, respectively. The dashed lines in panels b)−d) represent the cumulative distribution of observed planets shown in red in panel a). The vertical lines indicate locations of mean motion resonances.
Current usage metrics show cumulative count of Article Views (full-text article views including HTML views, PDF and ePub downloads, according to the available data) and Abstracts Views on Vision4Press platform.
Data correspond to usage on the plateform after 2015. The current usage metrics is available 48-96 hours after online publication and is updated daily on week days.
Initial download of the metrics may take a while.