Fig. 2
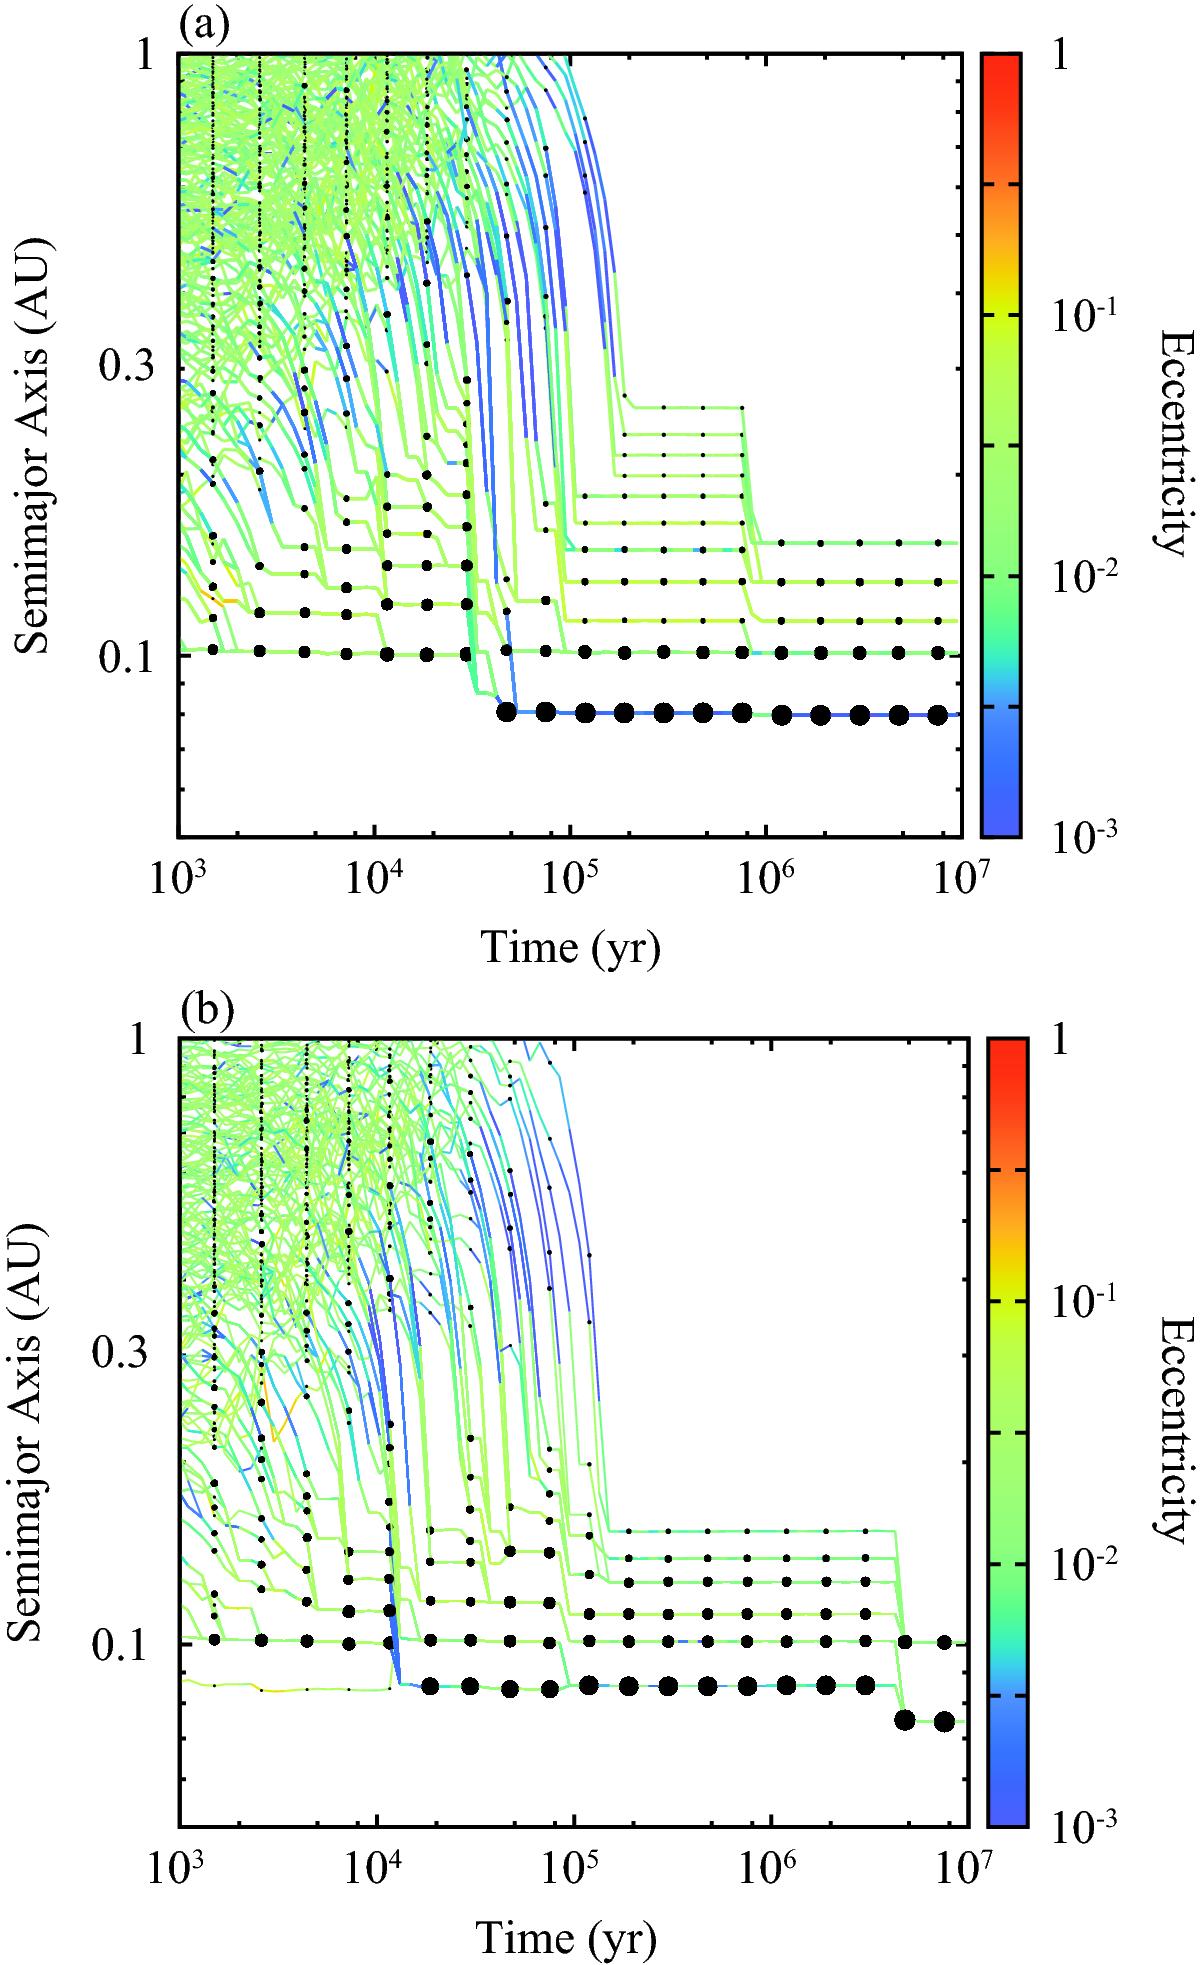
Time evolution of planets for Model 1. The filled circles connected with solid lines represent the sizes of planets. The smallest circle represents a 0.2 Earth-mass embryo, while the largest ones represent a 33 Earth-mass planet in panel a) and 35 Earth-mass planet in panel b). The color of line indicates the eccentricity (color bar).
Current usage metrics show cumulative count of Article Views (full-text article views including HTML views, PDF and ePub downloads, according to the available data) and Abstracts Views on Vision4Press platform.
Data correspond to usage on the plateform after 2015. The current usage metrics is available 48-96 hours after online publication and is updated daily on week days.
Initial download of the metrics may take a while.