| Issue |
A&A
Volume 578, June 2015
|
|
|---|---|---|
| Article Number | A33 | |
| Number of page(s) | 8 | |
| Section | Stellar structure and evolution | |
| DOI | https://doi.org/10.1051/0004-6361/201525832 | |
| Published online | 29 May 2015 | |
Oxygen isotopic ratios in intermediate-mass red giants
1
Department of AstrophysicsUniversity of Vienna,
Türkenschanzstrasse 17,
1180
Vienna,
Austria
e-mail:
This email address is being protected from spambots. You need JavaScript enabled to view it.
2
INAF, Osservatorio Astronomico di Collurania,
64100
Teramo,
Italy
e-mail:
This email address is being protected from spambots. You need JavaScript enabled to view it.
3
National Optical Astronomy Observatory,
PO Box 26732,
Tucson, AZ
85726,
USA
e-mail:
This email address is being protected from spambots. You need JavaScript enabled to view it.
4
Dipartimento di Fisica e Astronomia Galileo Galilei, Universita di
Padova, Vicolo dell’Osservatorio
3, 35122
Padova,
Italy
Received: 6 February 2015
Accepted: 1 April 2015
Abstract
Context. The abundances of the three main isotopes of oxygen are altered in the course of the CNO-cycle. When the first dredge-up mixes the burning products to the surface, the nucleosynthesis processes can be probed by measuring oxygen isotopic ratios.
Aims. By measuring 16O/17O and 16O/18O in red giants of known mass we compare the isotope ratios with predictions from stellar and galactic evolution modelling.
Methods. Oxygen isotopic ratios were derived from the K-band spectra of six red giants. The sample red giants are open cluster members with known masses of between 1.8 and 4.5 M⊙. The abundance determination employs synthetic spectra calculated with the COMARCS code. The effect of uncertainties in the nuclear reaction rates, the mixing length, and of a change in the initial abundance of the oxygen isotopes was determined by a set of nucleosynthesis and mixing models using the FUNS code.
Results. The observed 16O/17O ratios are in good agreement with the model results, even if the measured values do not present clear evidence of a variation with the stellar mass. The observed 16O/18O ratios are clearly lower than the predictions from our reference model. Variations in nuclear reaction rates and mixing length parameter both have only a very weak effect on the predicted values. The 12C/13C ratios of the K giants studied implies the absence of extra-mixing in these objects.
Conclusions. A comparison with galactic chemical evolution models indicates that the 16O/18O abundance ratio underwent a faster decrease than predicted. To explain the observed ratios, the most likely scenario is a higher initial 18O abundance combined with a lower initial 16O abundance. Comparing the measured 18O/17O ratio with the corresponding value for the interstellar medium points towards an initial enhancement of 17O as well. Limitations imposed by the observations prevent this from being a conclusive result.
Key words: nuclear reactions, nucleosynthesis, abundances / stars: abundances / stars: evolution / stars: late-type
Visiting astronomer, Kitt Peak National Observatory, National Optical Astronomy Observatory.
© ESO, 2015
1. Introduction
The ratios of the abundances of the three stable isotopes of oxygen, 16O/17O and 16O/18O, are important indicators of the nucleosynthesis and mixing in the interiors of stars (Dearborn 1992). In an H-burning environment 16O(p,γ)17F(β+)17O causes a steep increase in the 17O abundance until equilibrium is reached by the competitive 17O(p,α)14N process (Landre et al. 1990). Owing to the steep abundance gradient of 17O resulting from incomplete CNO-cycle burning, the surface abundance of the 17O isotope is highly sensitive to the precise depth of convection and the mixing profile in red giants (Boothroyd & Sackmann 1999). 18O is primarily produced via 14N(α,γ)18F(β+)18O (e.g. Clayton 2003). This reaction takes place in the He-burning shells of massive stars. The isotope is destroyed in hydrogen-burning stars by 18O(p,α)15N and destroyed during He burning by 18O(α,γ)22Ne. In low and intermediate mass stars, the 18O abundance thus reflects the initial abundance of this isotope and its destruction rate during hydrogen burning. The reaction rates for the processes including the various oxygen isotopes are relevant for later steps in the stellar nucleosynthesis, in particular the s-process (see the discussion in, e.g., Straniero et al. 2014).
The solar values for 16O/17O and 16O/18O are 2700 and 498 (Lodders et al. 2009), respectively. Based on the interplay between the production, mixing, and destruction of the oxygen isotopes, stellar evolution models predict a correlation between oxygen isotopic ratios and stellar mass for red giants after the first dredge-up (Boothroyd et al. 1994; El Eid 1994; Stoesz & Herwig 2003; Karakas & Lattanzio 2014). The various models agree on a steep decrease in the ratio 16O/17O between 1 and around 2 M⊙ followed by a weak increase in this ratio for higher masses. At the same time, the 16O/18O value after the first dredge-up is expected to show a moderate increase for stars below 2 M⊙ and a constant value afterwards. There are small quantitative differences for the predicted 16O/18O ratio between the models. A direct comparison of abundances is hampered by variations in the starting values chosen by the various models.
For testing the predictions, red-giant-branch (RGB) stars of known mass are crucial. El Eid (1994) attempted to do such a comparison with the help of a set of bright field stars. However, as noted by the author of that study, masses are rather uncertain for these objects. Accordingly, a convincing observational test of the models was not possible.
The CO vibration-rotation 4.6 μm fundamental or 2.3 μm first overtone bands were used in early determinations of O isotopes in red giants. The early determinations were limited to bright stars due to instrumental constraints (see Harris et al. 1988; Smith & Lambert 1990, and references therein). Contemporary instrumentation is much more sensitive, allowing the study of weaker targets at high spectral resolution and high signal-to-noise ratio. It is now possible to observe open-cluster (OC) red giants where stellar mass can be determined from the cluster age. Exploring the causes for oxygen isotopic ratios that deviate significantly from predictions based on the solar value provides insight into the cosmic matter cycle.
2. Sample definition and observations
For the target selection, we chose the list of red giants in galactic OC provided by Gilroy (1989) plus two stars in NGC 7789 from Prugniel et al. (2011). The total sample selected on the basis of observability (see below) and stellar mass includes seven stars. Gilroy (1989) provides the masses of the stars on the giant branch, and we used these values for our analysis. For NGC 7789 there are two recent age determinations of 1.4 Gyr (Kalirai et al. 2008) and 1.8 Gyr (Jacobson et al. 2011). When using isochrones from Bressan et al. (2012), the turn-off mass is 1.8 ± 0.2 M⊙. The metallicities of the selected clusters are close to solar (Gilroy 1989; Prugniel et al. 2011). Our sample of red giants is listed in Table 1.
Subsequent to taking the observations, we found that HD 49050 is no longer considered a member of NGC 2287 (Mermilliod et al. 2008). On the other hand, cluster membership of HD 16068 in Tr 2 and HD 27292 in NGC 1545 was confirmed by Začs et al. (2011). For HD 68879, Frinchaboy & Majewski (2008) list a cluster membership probability of more than 96%. For the other stars, their radial velocities are very close to the respective mean cluster velocity (Mermilliod et al. 2008), which supports their membership. A re-examination of the kinematics of the UMa group based on Hipparcos data leaves the membership of HD 30834 unclear (King et al. 2003).
We obtained several small pieces of high-resolution spectra in the H and K bands using the Phoenix spectrograph (Hinkle et al. 2000) at the Kitt Peak 2.1 m telescope. Observations were obtained in December 2013 and January 2014. The standard infrared observing procedure with two nodding positions was applied. Telluric lines were removed by ratioing the spectra to spectra of hot stars observed at similar airmass. The telluric lines in the hot star spectra were also used for the wavelength calibration.
3. Isotopic ratios
Our goal was to derive the 16O/17O, 16O/18O, and 12C/13C ratios for our seven target stars. Owing to the very limited spectral range of about 100 Å covered by a single observation, the number of spectral features available for our analysis is smaller than in the earlier studies based on FTS scans of the whole K-band region. To measure the 17O abundance we used two to four 2–0 band C17O lines located near 4285.4 cm-1. These lines are largely unblended and can be easily identified for a stellar temperature of up to 4200 K.
Determining the 18O abundance from K-band spectra is more difficult. We ultimately used a region around 4226 cm-1, which was used by García-Hernández et al. (2010) for their study of oxygen isotopes in R CrB stars. The most usable line of C18O in this region is the 2–0 R23 line, which is not affected significantly by telluric lines. However, this line is affected by an unidentified blend, so its usability for abundance determination is limited to Teff< 4100 K and log g< 2.0. An attempt to use the 2–0 band head of C18O, as in Smith & Lambert (1990), for instance, failed since the band head is located too close to the transmission cut-off of the Phoenix order separation filter.
Complimentary information on mixing in the stellar atmosphere was derived by measuring the 12C/13C ratio for our sample stars. Several first overtone 12C16O and 13C16O lines near 4246 cm-1 and 4262 cm-1 were used. We also attempted observations of the CO fundamental spectrum near 4.6 μm where many CO lines from all three oxygen isotopes can be found. However, lower flux levels, line blending, and difficulties in setting the continuum level limited the use of these data. The data presented in this paper are part of a larger observing programme on oxygen abundances in cool red giants. Details will be presented elsewhere.
Isotopic ratios were computed using spectrum synthesis techniques. For the stellar atmospheric structure, we used the hydrostatic spherical COMARCS models described in Aringer et al. (2009). Synthetic spectra were calculated with the COMA code using the same set of opacity data. Calculations were done under the assumption of LTE. We adopted values for solar composition provided by Caffau et al. (2009). Abundances were determined by a direct comparison between observed and synthetic spectra using both visual inspection and the measured line depths. For a more detailed description of our approach, we refer to earlier applications to the fitting of similar high resolution spectra given in Lebzelter et al. (2008) and Lederer et al. (2009). Line positions throughout the studied spectral range have been improved by using the work of Hinkle et al. (1995) and Hase et al. (2010). Data for the lines used in this analysis are listed in Table A.1.
Stellar parameters and isotopic ratios.
The line strengths depend on the stellar temperature, surface gravity, chemical composition, and abundance of each isotope. For the stars taken from the list of Gilroy (1989), we used the values for Teff and log g given there. McDonald et al. (2012) independently determined Teff values for HD 27292 (3844 K), HD 30834 (4247 K), and HD 68879 (4552 K), which are in reasonable agreement with the values given by Gilroy1. For the two stars in NGC 7789, the stellar parameters were taken from the study of Prugniel et al. (2011). Since all clusters have a metallicity close to solar (Gilroy 1989; Jacobson et al. 2011; Milone et al. 2011), we calculated our grid of synthetic spectra only for solar composition. For C/O we chose a fixed value of 0.3 to resemble a typical value for post first dredge-up composition. The microturbulence ξ was set 2.0 km s-1, which is a typical value for these stars according to Gilroy (1989). The macro turbulence was set to values between 1.5 and 2.5 km s-1 to optimize the fit of all stellar lines within the observed wavelength range. All parameters taken from the literature were cross-checked and confirmed with our spectra. The finally chosen values for Teff and log g are given in Cols. 4 and 5 of Table 1. Examples for the spectral fit are shown in Figs. 1 and 2. We note that our synthetic spectra cannot fit the cores of the strongest CO lines (lowest excitation) properly (e.g. Fig. 1). This difficulty has also been encountered by other authors (e.g. Tsuji 2008) and likely results from limitations of hydrostatic model atmospheres in describing the outer layers of a red giant properly.
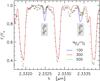 |
Fig. 1 Observed spectrum of HD 27292 (dots) showing two 12C17O lines. The three synthetic spectra (solid lines) are for Teff = 4000 K and log g = 1.5 with 16O/17O = 100, 300, and 500. |
The resulting oxygen isotopic ratios are listed in Table 1. The two stars in the cluster NGC 7789 show similar values. For the hottest star in our sample, HD 68879, we could not determine 16O/17O and 16O/18O because the CO lines were too weak. For HD 30834 we could not measure 16O/18O because the contribution of the C18O line to the blend could not be constrained properly. For this star, the value given for 16O/18O in Table 1 is a lower limit. We also determined carbon isotopic ratios for all our stars. The carbon isotope results are in good agreement with the values determined by Gilroy (1989) (see Table 1).
To interpret the 16O/17O and 16O/18O ratios, we need to check whether a solar 16O abundance value is appropriate for our sample stars. We did this by computing model spectra with altered oxygen abundances and with stellar parameters and carbon isotopic ratio as derived in the previous step. Since C/O < 1 the strengths of the CO lines are dependent on the carbon abundance and the isotopic ratios of oxygen but not on the total oxygen abundance. To derive the oxygen abundance, OH vibration-rotation lines in the H band were modelled. The H-band spectra around 6072 cm-1 were obtained for six of the K giants in Table 1. We modelled the three least blended 16OH lines, 4–2 P1f 6.5, 2–0 P1f 16.5, and 2–0 P2e 15.5. The resulting abundances listed in Table 1 were all sub-solar by –0.16 to –0.36 dex. The uncertainties are dominated by the temperature sensitivity of the chosen OH lines. As noted above, the total oxygen abundance has no effect on the strengths of the CO lines. We also do not expect that the oxygen abundance will affect the atmospheric structure because photospheric H2O is not present in the temperature range of our sample stars.
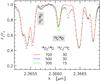 |
Fig. 2 Observed spectrum of HD 27292 (dots) with a 12C18O line and a 13C16O line marked. The three synthetic spectra (solid lines) are for Teff = 4000 K and log g = 1.5 with 16O/18O = 300, 500, and 700 and 12C/13C = 15 and 30, respectively. |
According to Gilroy (1989), the uncertainties of the stellar parameters are Δ Teff ± 150 K, Δlog g ± 0.3, Δ ξ ± 0.2 km s-1, and Δ [Fe/H] ± 0.2. Alternative parameter values found in the literature agree within these error bars. For each star we derived the isotopic ratios by changing the stellar parameters within these ranges. Some combinations, however, were not included when estimating the uncertainties because the corresponding synthetic spectra do not provide a good fit to the observations. Since the continuum level in the K band is well defined for these stars, we did not consider it to have an impact on the error budget. The final uncertainties, given in Table 1, were then determined by combining the maximum differences from changes in the stellar parameters with the scatter resulting when various lines were used for the abundance determination. The latter was typically a factor of 2 smaller than the uncertainties from the stellar parameters. As noted above we did not determine the C/O ratios from our spectra but set them to a fixed value of 0.3 in our analysis. We explored the effect of changing the C/O ratio by ±0.1 dex on the derived oxygen isotopic ratios. Such a change somewhat modifies the strength of all CO lines, but primarily those of weak or moderate strength. To achieve a good fit of the whole spectrum again, the stellar parameters have to be adapted so that the net effect on the isotopic ratios is small and covered by the error budget derived above. The effect of changing the macroturbulence value by 1 km s-1 is a few percent on the resulting isotopic ratio.
For HD 16068 and HD 27292, we also observed the M-band spectrum near 2154 cm-1. As mentioned above, the M-band spectra could not be used to derive reliable isotopic ratios. However, attempting to achieve a reasonable fit to the 4.6 μm spectra limits the 16O/17O and 16O/18O ratios to a range between 200 and 600, in agreement with the findings from the K band.
4. Nucleosynthesis and mixing models
To interpret the measured oxygen isotopic ratios, we have computed a set of stellar models by means of the FUNS (FUll Network Stellar evolution) code (Straniero et al. 2006). In practice, all the stable isotopes from H to F have been explicitly included in the H-burning nuclear network coupled to the stellar structure equations. The reaction rates have been taken from Iliadis et al. (2010) and Adelberger et al. (2011). The mixing length parameter, α = 1.82, was calibrated by means of a standard solar model computed with the same set of nuclear reaction rates, equation of state, radiative opacities, and composition as the models used in this study. Initial metallicity (Z = 0.015) and He abundance (Y = 0.27) are the early solar values as derived from the same standard solar model. The solar composition was taken from the list provided by Lodders et al. (2009). For details we refer to Piersanti et al. (2007). A comparison of FUNS predictions on stellar masses and cluster ages with the values derived by Gilroy (1989) showed good agreement within the uncertainties, so we refrained from re-determining the stellar masses of our sample stars. We point out that there is a minor inconsistency in our study in the sense that the oxygen abundance given by Lodders et al. (2009) is 0.07 dex lower than the value of Caffau et al. (2009) we used for computing the model spectra. Since the difference is very small, this inconsistency has negligible consequences on our analysis.
Stellar masses between 1.8 and 5.0 M⊙ have been investigated. The complete set of model parameter combinations and the corresponding results are summarized in Table 2. The first block (first 6 rows) refers to the reference models (R), those obtained with the recommended values of the reaction rates, the calibrated mixing length, and the solar composition. Then, to quantify the theoretical uncertainties, additional models have been computed by varying nucleosynthesis and mixing inputs, as well as the initial abundances of the three stable O isotopes.
As usual, all the models presented here include a treatment of the convective mixing. Therefore, red giant models show the composition modified by the first dredge-up. No extra mixing induced, for example, by rotation, thermohaline circulation, magnetic buoyancy, or gravity wave has been considered. As is well known these processes are hampered in red giant stars by the sharp molecular weight gradient left by the first dredge-up. Only in stars with M ≤ 2 M⊙ does the shell H-burning reach the H discontinuity during the RGB phase, thus smoothing down the μ − gradient. With the possible exception of the two NGC 7789 stars, all the other stars in our sample have masses higher than 2 M⊙. In the model with M = 1.8 M⊙, the H-burning attains the H discontinuity when log (L/L⊙) ~ 2. The two giant stars observed in NGC 7789 are slightly brighter than this threshold2 so some extramixing has possibly modified their compositions. However, the observed 12C/13C (Table 1) is only slightly smaller than the value expected after the FDU and, in any case, within the error bar. The O isotopic ratios are not affected by moderate extramixing (see, e.g., Abia et al. 2012).
Effects of theoretical uncertainties on 12C/13C, 16O/17O, and 16O/18O.
5. Discussion
5.1. 17O
All of the six sample K giants with determined oxygen isotopic ratios show a very similar 16O/17O ratio between 250 and 300. Reference models, i.e. those obtained starting from a solar composition, account for the observed values within the observational errors. On the other hand, this agreement does not necessarily imply that the protostellar 17O abundances were nearly solar. In the H-burning shell, the 17O is directly linked to the 16O through the NO cycle (see Fig. 3). Therefore, the final 16O/17O is basically fixed by the initial abundance of the most abundant isotope of the cycle, 16O, with variations of the initial 17O having a negligible effect. This is demonstrated by model C17OH with an initial 17O abundance 34% higher than the reference model but nonetheless a final 16O/17O ratio that is practically identical to the reference model. However, a variation in the initial 16O will modify the isotope ratios after the first dredge-up. Nevertheless, a partial redistribution of the 16O excess or deficiency over all the isotopes of the NO cycle mitigates the change in the final 16O/17O. All the six giants in our sample show clear signatures of subsolar [16O/H], with an average value − 0.25 ± 0.03 (see Table 1). Models C16OL demonstrate that such a 40% reduction of the initial 16O would imply a ~14% reduction of the final 16O/17O ratios, which is still compatible with the observed ratios (within 1σ; see also the black-solid curve in Fig. 4).
Variations in the nuclear reaction rates have weak effects compared to the observational uncertainties. A change of Z from 0.15 to 0.02 implies a 10% increase in the 16O/17O. On the contrary, a 10% reduction is obtained if Y is changed from 0.27 to 0.32.
As a whole, at variance with model predictions, the measured 16O/17O ratios do not show any clear evidence of a variation with the stellar mass. However, the small number of observations, also affected by a rather large error, hampers any more thorough investigation of this issue. As outlined in Lebzelter et al. (2012), reducing the errors is hindered by fundamental problems in determining stellar parameters for cool giants. Effects of changes in the mixing length parameter are similarly far below the observational detectability.
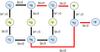 |
Fig. 3 Illustration of the network of nuclear reactions within the CNO cycle. |
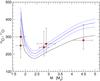 |
Fig. 4 16O/17O ratios after the first dredge-up versus stellar mass in M⊙. Lines represent the theoretical predictions, and the red squares are observations. Blue solid line: reference model (R). Blue dashed lines: 17O proton capture rate modified within the suggested upper and lower rates (O17L and O17H). Solid black line: theoretical predictions as obtained by reducing the initial 16O to [16O/H] = –0.22 (C16OL). |
5.2. 18O
The models show that the 16O/18O ratio after the first dredge-up is almost constant (for M ≥ 2 M⊙). However, the five K giants analysed here have typical values near 350, which is about half the value predicted by the reference models (R). None of the sample stars has an 18O abundance in the literature. While our values seem to be amongst the lowest 16O/18O ratios measured in evolved giants, 16O/18O values around 400 have been measured in field giants. Harris et al. (1988) report similar values for the bright stars α Ari, α Ser, β And, β Peg, and β UMi. The Harris et al. (1988) study used different molecular lines than we have selected, which indicate that such low ratios are probably not the result of an inappropriate selection of spectral lines. All but one red giant studied by Harris et al. (1988) were found to have 16O/18O ratios ≤600.
As for 17O, our tests of the uncertainties of the nucleosynthesis model show that the only route to significantly modifying the 16O/18O ratio after the first dredge-up is to change the initial abundances of individual isotopes. At variance with the 17O, for which only a variation in the initial 16O abundance affects the final 16O/17O, a modification of the initial 18O could play an important role in interpreting the measured 16O/18O ratio. Owing to the weakness of the 17O(p,γ)18F reaction, 18O remains decoupled from the CNO cycle (see Fig. 3). On the other hand, it can be easily destroyed by fast proton captures (mainly by the 18O(p,α)15N reaction) so that the 16O/18O ratio should increase after the first dredge-up3. Our models show that for any choice of the initial 16O,18O abundance pair and for any initial mass, the final 16O/18O will always be ~1.4 times greater than the corresponding initial value. For this reason, starting from a solar value of the 16O/18O ratio, ~500, it is impossible to account for the measured values. Our models require that either the 16O or the 18O be varied in order to match the observations. For instance, model C18OHH with an initial 18O twice solar abundance matches the observed 16O/18O. However, this is also the result when using model C16OLL with an initial 16O abundance half solar. It follows that combinations of these two assumptions also provide a good reproduction of the observations. For instance, assuming a 40% reduction of the initial 16O, as implied by the observed average [16O/H], results in 16O/18O, which is in reasonable agreement with the measured value (within 1σ; Fig. 5). The agreement can be improved further by increasing the initial 18O about 10%.
5.3. Implications of the results
By combining [16O/H], 16O/17O, and 16O/18O measurements in six giants belonging to galactic OC of known ages, we can infer the O isotopic composition of the respective protostellar nebulae. In particular, the optimal protostellar abundances modelled from the observed stellar abundances imply subsolar 16O, i.e. − 40% on the average, and slightly supersolar 18O, i.e. + 10%. The 16O/18O ratios in the protostellar gas are reduced by a factor of ~1.4 from the values measured in the red giant stars. No direct information on the protostellar 17O can be obtained from our observations.
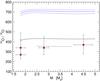 |
Fig. 5 16O/18O ratios after the first dredge-up versus stellar mass in M⊙. Lines represent the theoretical predictions, and the red squares are observations. Solid blue line: reference model (R). Dashed blue lines: 18O proton capture rate modified within the suggested upper and lower rates (O18L and O18H). Solid black line: model predictions obtained by reducing the initial 16O to [16O/H] = –0.22 (C16OL). Dashed black line: model with the initial 18O abundance increased by a factor of 2 (C18OHH). |
Is this picture that arises from our measurements in OC giants compatible with the predictions of extant models of galactic chemical evolution4 (GCE)? 16O is a primary product of the He burning. It is produced through the main He-burning chain: 3α → 12C+ α → 16O. 18O is also produced in He-burning regions as a secondary product synthesized through the following chain: 14N(α,γ)18F(β)18O, where the abundance of 14N is equivalent, in practice, to the original amount of C+N+O. The most efficient polluters of both 16O and 18O are massive stars exploding as core-collapse supernovae. 17O is a secondary product of the H burning (CNO cycle, see Fig. 3). Therefore, in addition to massive stars, the winds of intermediate and low mass stars contribute on a longer timescale to the oxygen pollution of the ISM by contributing 17O. In this framework, it is not a surprise that GCE models generally predict an increase with time in both the 16O/18O and the 16O/17O, as expected for the ratio of a primary to a secondary product. Less straightforward is the evolution of the ratio of the two secondary O isotopes. In general, when two secondary isotopes are produced by the same class of stars, their ratio should remain constant. However, this is not the case for 18O/17O, which is expected to decrease when low and intermediate mass stars begin to contribute to the pollution of the lightest isotope (Clayton 1988; Prantzos et al. 1996; Meyer et al. 2008; Kobayashi et al. 2011; Nittler & Gaidos 2012).
In Fig. 6 predictions of the Prantzos et al. (1996) GCE model are compared with our estimates of 18O/16O in the parent nebulae of the OC. The solid line represents the predicted evolution of the 18O/16O ratio over the past 6 Gyr. The CGE model refers to abundances in the interstellar medium (ISM) at the current solar galactocentric radius, RGC = 8.5 kpc. The 18O/16O ratio is plotted relative to the solar value while time is scaled to the epoch of the solar system formation. Red squares show our isotope ratio estimates for the three clusters NGC 7789, NGC 1545, and Tr 2. In spite of the large uncertainties, it appears that the primordial gas of the three clusters underwent a faster increase in the 18O abundance than predicted from the GCE model. This figure does not change by using the more recent Kobayashi et al. (2011) GCE model. The galactocentric distance of the three clusters is only slightly greater than solar, between 9 kpc and 9.7 kpc. Although migration of the Sun and the clusters5 from small galactocentric radius cannot be excluded, the birthplaces should be within 6 <RGC< 10 kpc.
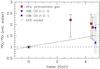 |
Fig. 6 Evolution of 18O/16O with time. The isotopic ratio is plotted relative to the solar value. The zero point of the time axis is defined by the formation of the Sun. The solid black line indicates the predictions from galactic chemical evolution (GCE) models. Red boxes mark our estimates of 18O/16O in the parent nebulae of the three OCs NGC 7789, NGC 1545, and Tr2. The two measurements for NGC 7789 have been combined to one point. Blue symbols indicate ISM values. The shaded area is representative of the whole range of ISM measurements. |
Oxygen isotopic ratios in molecular clouds located in this portion of the Galaxy are available from infrared and radio observations (Wouterloot et al. 2008; Milam et al. 2005; Polehampton et al. 2005). Nittler & Gaidos (2012) have derived 18O/16O for molecular clouds by combining 13C16O/12C18O reported by Wouterloot et al. (2008) with the galactic 12C/13C gradient obtained by Milam et al. (2005) from CO observations. The two triangles in Fig. 6 represent the weighted averages of these measurements, as obtained from two different molecular lines, CO J = 1–0 and CO J = 2–1. Only molecular clouds for 6 <RGC< 10 kpc have been considered. Other measurements, derived from OH lines (Polehampton et al. 2005) and formaldehyde data (Wilson & Rood 1994), are within the range covered by the CO measurements. In the same figure, the shaded area is representative of the whole set of available measurements for the ISM lying on the galactic disk approximately between 6 and 10 kpc (see also Fig. 2 in Nittler & Gaidos 2012). Compared to the ISM, the 18O/16O ratios we have derived for three OCs are close to the upper bound of the available measurements.
Although we cannot constrain the protostellar 17O from OC giant observations, molecular clouds located between 6 and 1 kpc from the galactic centre show that the 18O/17O ratio ranges between 3 and 5, with an average value 4.16 ± 0.09 (Wouterloot et al. 2008; see also Penzias 1981 and Milam et al. 2005). Since the ratio of these two secondary isotopes can either remain constant or decrease with time and since our measurements indicate slightly supersolar 18O in the ISM from which the host clusters were born, a similar or even larger enhancement of 17O is expected, otherwise the initial 18O/17O would be definitely too large compared to the typical values found in the galactic disk.
6. Conclusions
We measured the ratios of the three main isotopes of oxygen in the atmospheres of six evolved K giants. Except for one the stars are members of stellar clusters and therefore have well-defined masses. The 16O/17O and 16O/18O ratios are compared with model predictions. There is agreement between observations and predictions for the 16O/17O ratio. The dependency of 16O/17O on mass, expected from nucleosynthesis models, is not observed. However, the predicted variation is comparable to the data errors. The observed 16O/18O ratio can be brought into agreement with model predictions if the initial isotopic ratio is about half of the solar value. Uncertainties in proton capture rates and mixing length cannot account for the observed difference. By combining this result with our estimation of the [16O/H], we conclude that a moderate enhancement of the initial 18O abundance relative to the solar value in combination with a subsolar 16O abundance can provide a good match to the observations. Finally, to maintain the protostellar 18O/17O in agreement with the values typically measured in nearby molecular clouds, we also infer a moderate enhancement of the initial 17O abundance.
Cesetti et al. (2013) list a rather high temperature of 6427 K for HD 16068. They refer to a parameter determination by Holmberg et al. (2008). However, we could not find this star in the latter catalogue. Therefore, we suppose there is a mistake in Cesetti et al. (2013).
The luminosity may be estimated by means of Teff and log g listed in Table 1.
As previously noted 16O is practically unaffected by the first dredge-up.
Isotopic ratios of oxygen measured in stars are typically given as 16O/xxO in the literature. Accordingly, we used this format of the isotopic ratio in the first part of the paper. Galactic chemical evolution models, however, often give the reversed ratio xxO/16O. Therefore, we decided to use xxO/16O in this section to allow for an easier comparison with the literature.
Effects of migration are probably small for the two younger clusters, NGC 1545 and Tr 2, while it cannot be excluded in the case of NGC 7789 (1.7 Gyr old).
Acknowledgments
We are indebted to Larry Nittler for providing a computer-readable table with his derivation of the 16O/18O in molecular clouds. We thank the anonymous referee for the very valuable comments. T.L. and W.N. were supported by Austrian Science Fund FWF under project number P23737-N16. W.N. was also supported by project P21988-N16. B.A. acknowledges the support from the project STARKEY funded by the ERC Consolidator Grant, G.A. No. 615604. This paper is based on observations obtained at the Kitt Peak National Observatory (NOAO Prop. ID:2013B-0218; PI: T. Lebzelter). The Kitt Peak National Observatory is part of the National Optical Astronomy Observatory, which is operated by the Association of Universities for Research in Astronomy (AURA) under cooperative agreement with the National Science Foundation.
References
- Abia, C., Palmerini, S., Busso, M., & Cristallo, S. 2012, A&A, 548, A55 [NASA ADS] [CrossRef] [EDP Sciences] [Google Scholar]
- Adelberger, E. G., García, A., Robertson, R. G. H., et al. 2011, Rev. Mod. Phys., 83, 195 [NASA ADS] [CrossRef] [Google Scholar]
- Aringer, B., Girardi, L., Nowotny, W., Marigo, P., & Lederer, M. T. 2009, A&A, 503, 913 [NASA ADS] [CrossRef] [EDP Sciences] [Google Scholar]
- Boothroyd, A. I., & Sackmann, I.-J. 1999, ApJ, 510, 232 [Google Scholar]
- Boothroyd, A. I., Sackmann, I.-J., & Wasserburg, G. J. 1994, ApJ, 430, L77 [NASA ADS] [CrossRef] [Google Scholar]
- Bressan, A., Marigo, P., Girardi, L., et al. 2012, MNRAS, 427, 127 [NASA ADS] [CrossRef] [Google Scholar]
- Caffau, E., Ludwig, H.-G., & Steffen, M. 2009, Mem. Soc. Astron. It., 80, 643 [NASA ADS] [Google Scholar]
- Cesetti, M., Pizzella, A., Ivanov, V. D., et al. 2013, A&A, 549, A129 [NASA ADS] [CrossRef] [EDP Sciences] [Google Scholar]
- Clayton, D. D. 1988, ApJ, 334, 191 [NASA ADS] [CrossRef] [Google Scholar]
- Clayton, D. 2003, Handbook of Isotopes in the Cosmos (Cambridge, UK: Cambridge University Press), 97 [Google Scholar]
- Dearborn, D. S. P. 1992, Phys. Rep., 210, 367 [NASA ADS] [CrossRef] [Google Scholar]
- El Eid, M. F. 1994, A&A, 285, 915 [NASA ADS] [Google Scholar]
- Frinchaboy, P. M., & Majewski, S. R. 2008, AJ, 136, 118 [NASA ADS] [CrossRef] [Google Scholar]
- García-Hernández, D. A., Lambert, D. L., Kameswara Rao, N., Hinkle, K. H., & Eriksson, K. 2010, ApJ, 714, 144 [NASA ADS] [CrossRef] [Google Scholar]
- Gilroy, K. K. 1989, ApJ, 347, 835 [NASA ADS] [CrossRef] [Google Scholar]
- Goorvitch, D. 1994, ApJS, 95, 535 [NASA ADS] [CrossRef] [Google Scholar]
- Harris, M. J., Lambert, D. L., & Smith, V. V. 1988, ApJ, 325, 768 [NASA ADS] [CrossRef] [Google Scholar]
- Hase, F., Wallace, L., McLeod, S. D., Harrison, J. J., & Bernath, P. F. 2010, J. Quant. Spec. Radiat. Transf., 111, 521 [Google Scholar]
- Hinkle, K., Wallace, L., & Livingston, W. C. 1995, PASP, 107, 1042 [NASA ADS] [CrossRef] [Google Scholar]
- Hinkle, K. H., Joyce, R. R., Sharp, N., & Valenti, J. A. 2000, in Optical and IR Telescope Instrumentation and Detectors, eds. M. Iye, & A. F. Moorwood, SPIE Conf. Ser., 4008, 720 [Google Scholar]
- Holmberg, J., Nordstroem, B., & Andersen, J. 2008, VizieR Online Data Catalog, V/128 [Google Scholar]
- Iliadis, C., Longland, R., Champagne, A. E., Coc, A., & Fitzgerald, R. 2010, Nucl. Phys. A, 841, 31 [NASA ADS] [CrossRef] [Google Scholar]
- Jacobson, H. R., Pilachowski, C. A., & Friel, E. D. 2011, AJ, 142, 59 [NASA ADS] [CrossRef] [Google Scholar]
- Kalirai, J. S., Hansen, B. M. S., Kelson, D. D., et al. 2008, ApJ, 676, 594 [NASA ADS] [CrossRef] [Google Scholar]
- Karakas, A. I., & Lattanzio, J. C. 2014, PASA, 31, 30 [Google Scholar]
- King, J. R., Villarreal, A. R., Soderblom, D. R., Gulliver, A. F., & Adelman, S. J. 2003, AJ, 125, 1980 [NASA ADS] [CrossRef] [Google Scholar]
- Kobayashi, C., Karakas, A. I., & Umeda, H. 2011, MNRAS, 414, 3231 [NASA ADS] [CrossRef] [Google Scholar]
- Landre, V., Prantzos, N., Aguer, P., et al. 1990, A&A, 240, 85 [NASA ADS] [Google Scholar]
- Lebzelter, T., Lederer, M. T., Cristallo, S., et al. 2008, A&A, 486, 511 [NASA ADS] [CrossRef] [EDP Sciences] [Google Scholar]
- Lebzelter, T., Heiter, U., Abia, C., et al. 2012, A&A, 547, A108 [NASA ADS] [CrossRef] [EDP Sciences] [Google Scholar]
- Lederer, M. T., Lebzelter, T., Cristallo, S., et al. 2009, A&A, 502, 913 [NASA ADS] [CrossRef] [EDP Sciences] [Google Scholar]
- Lodders, K., Palme, H., & Gail, H.-P. 2009, Landolt Börnstein (Springer), 44 [Google Scholar]
- McDonald, I., Zijlstra, A. A., & Boyer, M. L. 2012, MNRAS, 427, 343 [NASA ADS] [CrossRef] [Google Scholar]
- Mermilliod, J. C., Mayor, M., & Udry, S. 2008, A&A, 485, 303 [NASA ADS] [CrossRef] [EDP Sciences] [Google Scholar]
- Meyer, B. S., Nittler, L. R., Nguyen, A. N., & Messenger, S. 2008, in Oxygen in the Solar System, eds. G. MacPherson, D. Mittlefehldt, S. Jones, J. Simon, & S. Mackwell (Chantilly. VA: Mineralogical Society of America), Rev. Min. Geoch., 68, 31 [Google Scholar]
- Milam, S. N., Savage, C., Brewster, M. A., Ziurys, L. M., & Wyckoff, S. 2005, ApJ, 634, 1126 [NASA ADS] [CrossRef] [Google Scholar]
- Milone, A. D. C., Sansom, A. E., & Sánchez-Blázquez, P. 2011, MNRAS, 414, 1227 [NASA ADS] [CrossRef] [Google Scholar]
- Nittler, L. R., & Gaidos, E. 2012, Meteor. Planet. Sci., 47, 2031 [Google Scholar]
- Penzias, A. A. 1981, ApJ, 249, 518 [NASA ADS] [CrossRef] [Google Scholar]
- Piersanti, L., Straniero, O., & Cristallo, S. 2007, A&A, 462, 1051 [NASA ADS] [CrossRef] [EDP Sciences] [Google Scholar]
- Polehampton, E. T., Baluteau, J.-P., & Swinyard, B. M. 2005, A&A, 437, 957 [NASA ADS] [CrossRef] [EDP Sciences] [Google Scholar]
- Prantzos, N., Aubert, O., & Audouze, J. 1996, A&A, 309, 760 [NASA ADS] [Google Scholar]
- Prugniel, P., Vauglin, I., & Koleva, M. 2011, A&A, 531, A165 [NASA ADS] [CrossRef] [EDP Sciences] [Google Scholar]
- Rothman, L. S., Gordon, I. E., Barbe, A., et al. 2009, J. Quant. Spectr. Rad. Transf., 110, 533 [NASA ADS] [CrossRef] [Google Scholar]
- Smith, V. V., & Lambert, D. L. 1990, ApJS, 72, 387 [NASA ADS] [CrossRef] [Google Scholar]
- Stoesz, J. A., & Herwig, F. 2003, MNRAS, 340, 763 [NASA ADS] [CrossRef] [Google Scholar]
- Straniero, O., Gallino, R., & Cristallo, S. 2006, Nucl. Phys. A, 777, 311 [NASA ADS] [CrossRef] [Google Scholar]
- Straniero, O., Cristallo, S., & Piersanti, L. 2014, ApJ, 785, 77 [NASA ADS] [CrossRef] [Google Scholar]
- Tsuji, T. 2008, A&A, 489, 1271 [NASA ADS] [CrossRef] [EDP Sciences] [Google Scholar]
- Wilson, T. L., & Rood, R. 1994, ARA&A, 32, 191 [NASA ADS] [CrossRef] [Google Scholar]
- Wouterloot, J. G. A., Henkel, C., Brand, J., & Davis, G. R. 2008, A&A, 487, 237 [NASA ADS] [CrossRef] [EDP Sciences] [Google Scholar]
- Začs, L., Alksnis, O., Barzdis, A., et al. 2011, MNRAS, 417, 649 [NASA ADS] [CrossRef] [Google Scholar]
Appendix A: Line data
Molecular lines of 12C16O (selection), 12C17O, 12C18O, 13C16O, and 16OH used in the analysis.
All Tables
Molecular lines of 12C16O (selection), 12C17O, 12C18O, 13C16O, and 16OH used in the analysis.
All Figures
|
Fig. 1 Observed spectrum of HD 27292 (dots) showing two 12C17O lines. The three synthetic spectra (solid lines) are for Teff = 4000 K and log g = 1.5 with 16O/17O = 100, 300, and 500. |
| In the text | |
|
Fig. 2 Observed spectrum of HD 27292 (dots) with a 12C18O line and a 13C16O line marked. The three synthetic spectra (solid lines) are for Teff = 4000 K and log g = 1.5 with 16O/18O = 300, 500, and 700 and 12C/13C = 15 and 30, respectively. |
| In the text | |
|
Fig. 3 Illustration of the network of nuclear reactions within the CNO cycle. |
| In the text | |
|
Fig. 4 16O/17O ratios after the first dredge-up versus stellar mass in M⊙. Lines represent the theoretical predictions, and the red squares are observations. Blue solid line: reference model (R). Blue dashed lines: 17O proton capture rate modified within the suggested upper and lower rates (O17L and O17H). Solid black line: theoretical predictions as obtained by reducing the initial 16O to [16O/H] = –0.22 (C16OL). |
| In the text | |
|
Fig. 5 16O/18O ratios after the first dredge-up versus stellar mass in M⊙. Lines represent the theoretical predictions, and the red squares are observations. Solid blue line: reference model (R). Dashed blue lines: 18O proton capture rate modified within the suggested upper and lower rates (O18L and O18H). Solid black line: model predictions obtained by reducing the initial 16O to [16O/H] = –0.22 (C16OL). Dashed black line: model with the initial 18O abundance increased by a factor of 2 (C18OHH). |
| In the text | |
|
Fig. 6 Evolution of 18O/16O with time. The isotopic ratio is plotted relative to the solar value. The zero point of the time axis is defined by the formation of the Sun. The solid black line indicates the predictions from galactic chemical evolution (GCE) models. Red boxes mark our estimates of 18O/16O in the parent nebulae of the three OCs NGC 7789, NGC 1545, and Tr2. The two measurements for NGC 7789 have been combined to one point. Blue symbols indicate ISM values. The shaded area is representative of the whole range of ISM measurements. |
| In the text | |
Current usage metrics show cumulative count of Article Views (full-text article views including HTML views, PDF and ePub downloads, according to the available data) and Abstracts Views on Vision4Press platform.
Data correspond to usage on the plateform after 2015. The current usage metrics is available 48-96 hours after online publication and is updated daily on week days.
Initial download of the metrics may take a while.