Fig. 5
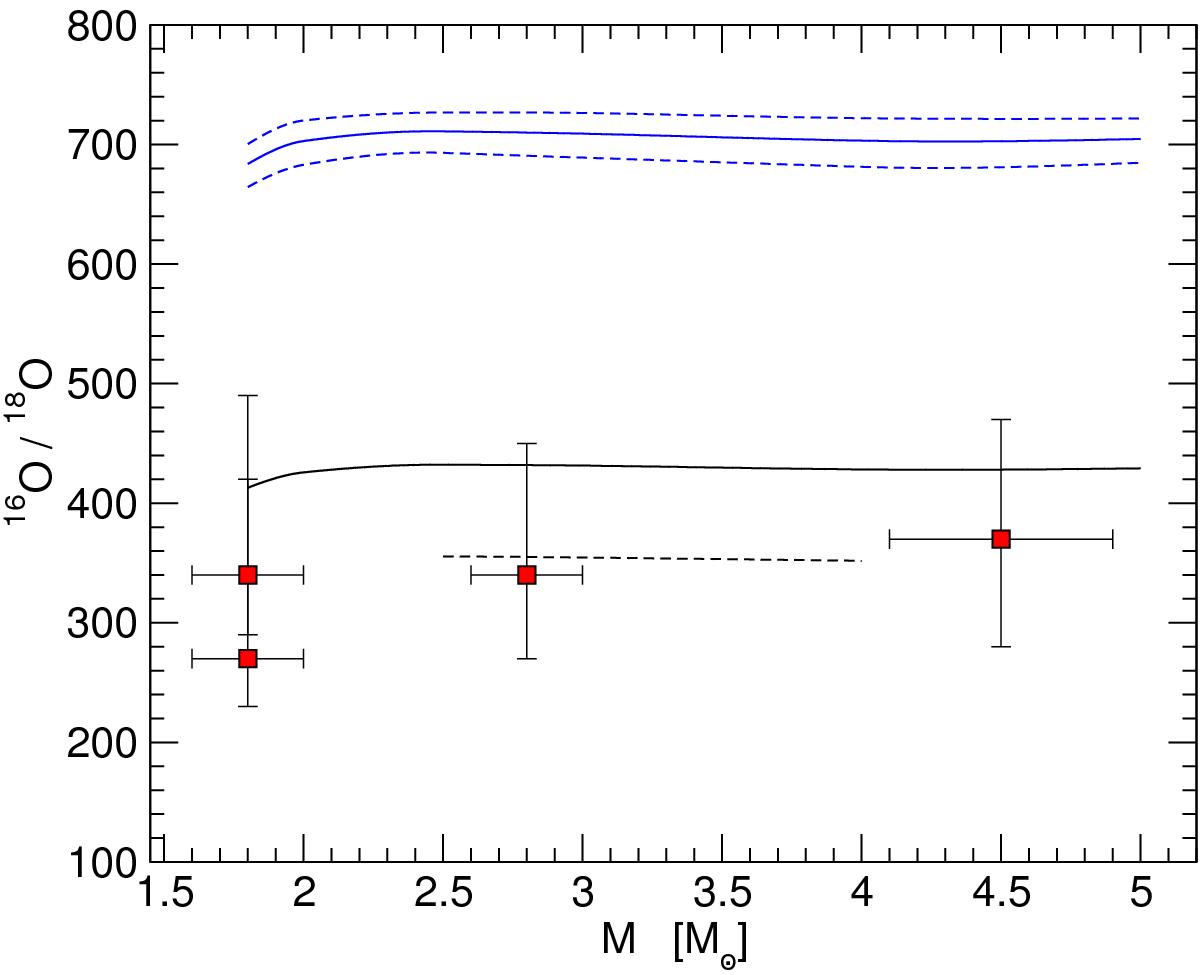
16O/18O ratios after the first dredge-up versus stellar mass in M⊙. Lines represent the theoretical predictions, and the red squares are observations. Solid blue line: reference model (R). Dashed blue lines: 18O proton capture rate modified within the suggested upper and lower rates (O18L and O18H). Solid black line: model predictions obtained by reducing the initial 16O to [16O/H] = –0.22 (C16OL). Dashed black line: model with the initial 18O abundance increased by a factor of 2 (C18OHH).
Current usage metrics show cumulative count of Article Views (full-text article views including HTML views, PDF and ePub downloads, according to the available data) and Abstracts Views on Vision4Press platform.
Data correspond to usage on the plateform after 2015. The current usage metrics is available 48-96 hours after online publication and is updated daily on week days.
Initial download of the metrics may take a while.