Fig. 6
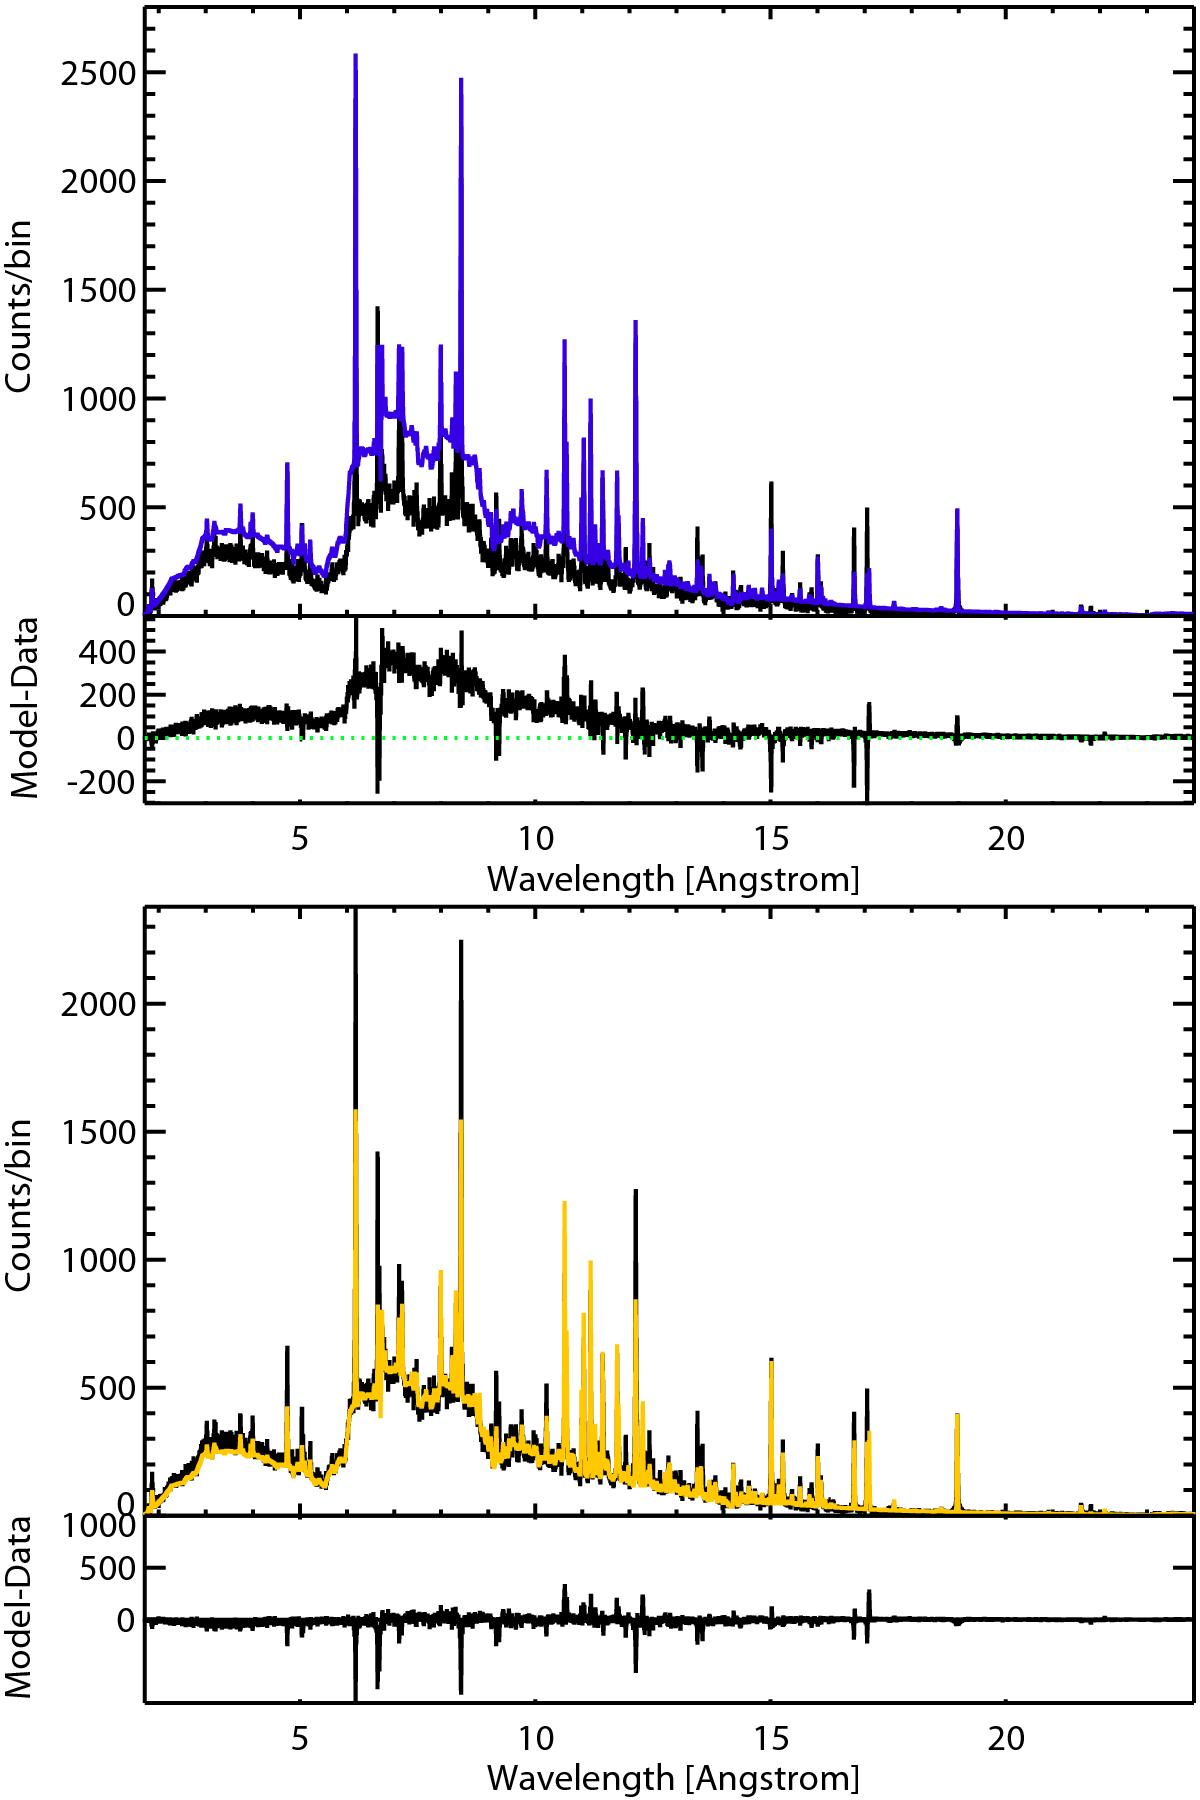
Comparison between the Chandra MEG±1 spectrum (black full line) and spectra obtained from the different models discussed in Sect. 4. Top: accretion column with a magnetic dipole geometry and change of gravitational potential with height (blue full line, Model B, see Sect. 4.3 for details). Bottom: EMD derived from the fit of the loci curves obtained from the flux measurements (orange full line, Model D, see Sect. 4.6 for details). The model-data panels show that the continuum emission from model B overestimates the data. Given that all the spectral models were derived assuming the same accretion rate, Ṁ = 1.74 × 10¹⁵ g s-1, model B requires lower accretion rates to match the data.
Current usage metrics show cumulative count of Article Views (full-text article views including HTML views, PDF and ePub downloads, according to the available data) and Abstracts Views on Vision4Press platform.
Data correspond to usage on the plateform after 2015. The current usage metrics is available 48-96 hours after online publication and is updated daily on week days.
Initial download of the metrics may take a while.