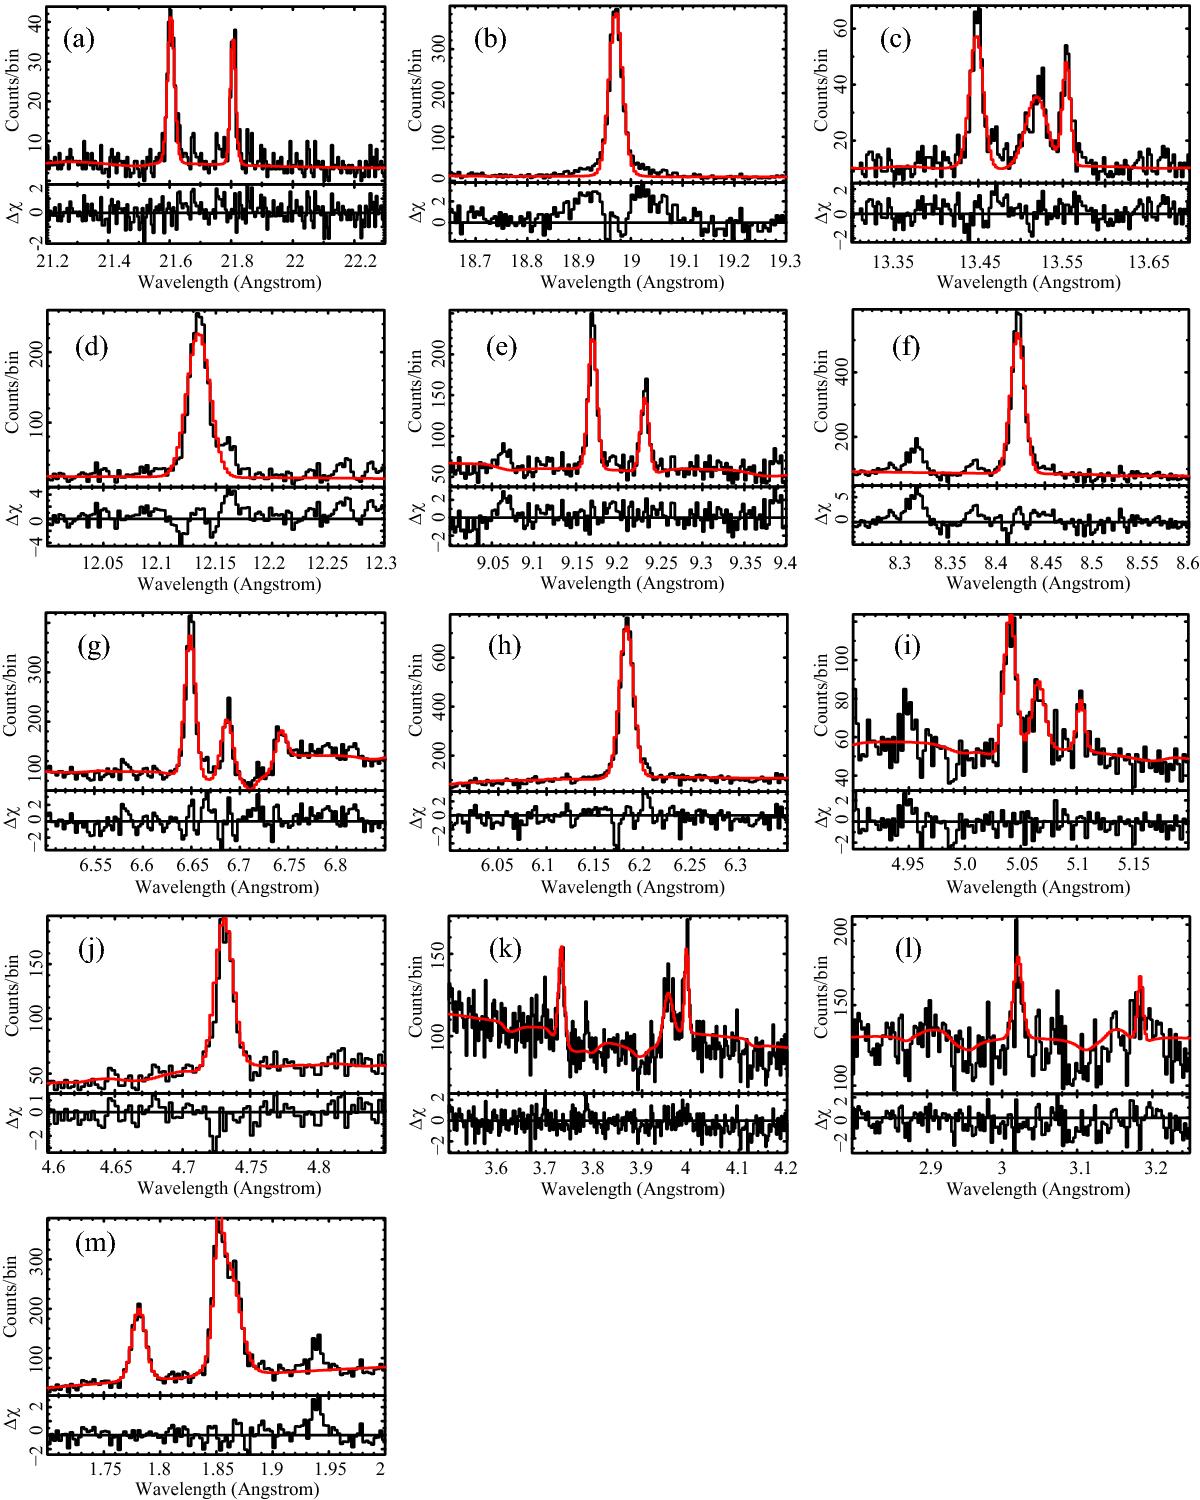
Fig. 1

Observed emission-line profiles with overlaid Gaussian models of a) O VII λ21.6 and O VII λ21.8 (MEG ± 1); b) O VIII λ18.97 (HEG ± 1); c) Ne IX λ13.45 and Ne IX λ13.55 (HEG ± 1); d) Ne X λ12.13 (HEG ± 1); e) Mg XI λ9.16 and Mg XI λ9.23 (HEG ± 1); f) Mg XII λ8.42 (HEG ± 1); g) Si XIII λ6.64, Si XIII λ6.68, and Si XIII λ6.74 (HEG ± 1); h) Si XIV λ6.18 (HEG± 1); i) S XV λ5.04, S XV λ5.06, and S XV λ5.10 (HEG ± 1); j) S XVI λ4.73 (HEG ± 1); k) Ar XVIII λ3.73, Ar XVII λ3.944 + Ar XVII λ3.961 + Ar XVII λ3.965, and Ar XVII λ3.994 + S XVI λ3.992 + S XVI λ3.991 (HEG ± 1); l) Ca XX λ3.02 and Ca XIX λ3.17 (HEG ± 1); and m) Fe XXVI λ1.78, Fe XXV λ1.85 and Fe XXV λ1.86 (HEG ± 1), where the HETG data and model profiles are shown with black and red histograms, respectively. Below each panel, we plot the fit residuals. Where overlapping, the HEG±1 and MEG±1 spectra were fit simultaneously; HEG±1 is shown for illustrative purposes. As discussed in Luna et al. (2010), the broad wings in the residuals to the fits of some of the emission lines – O VIII in particular – are due to emission by the photoionized preshock accretion flow.
Current usage metrics show cumulative count of Article Views (full-text article views including HTML views, PDF and ePub downloads, according to the available data) and Abstracts Views on Vision4Press platform.
Data correspond to usage on the plateform after 2015. The current usage metrics is available 48-96 hours after online publication and is updated daily on week days.
Initial download of the metrics may take a while.


