Fig. 2
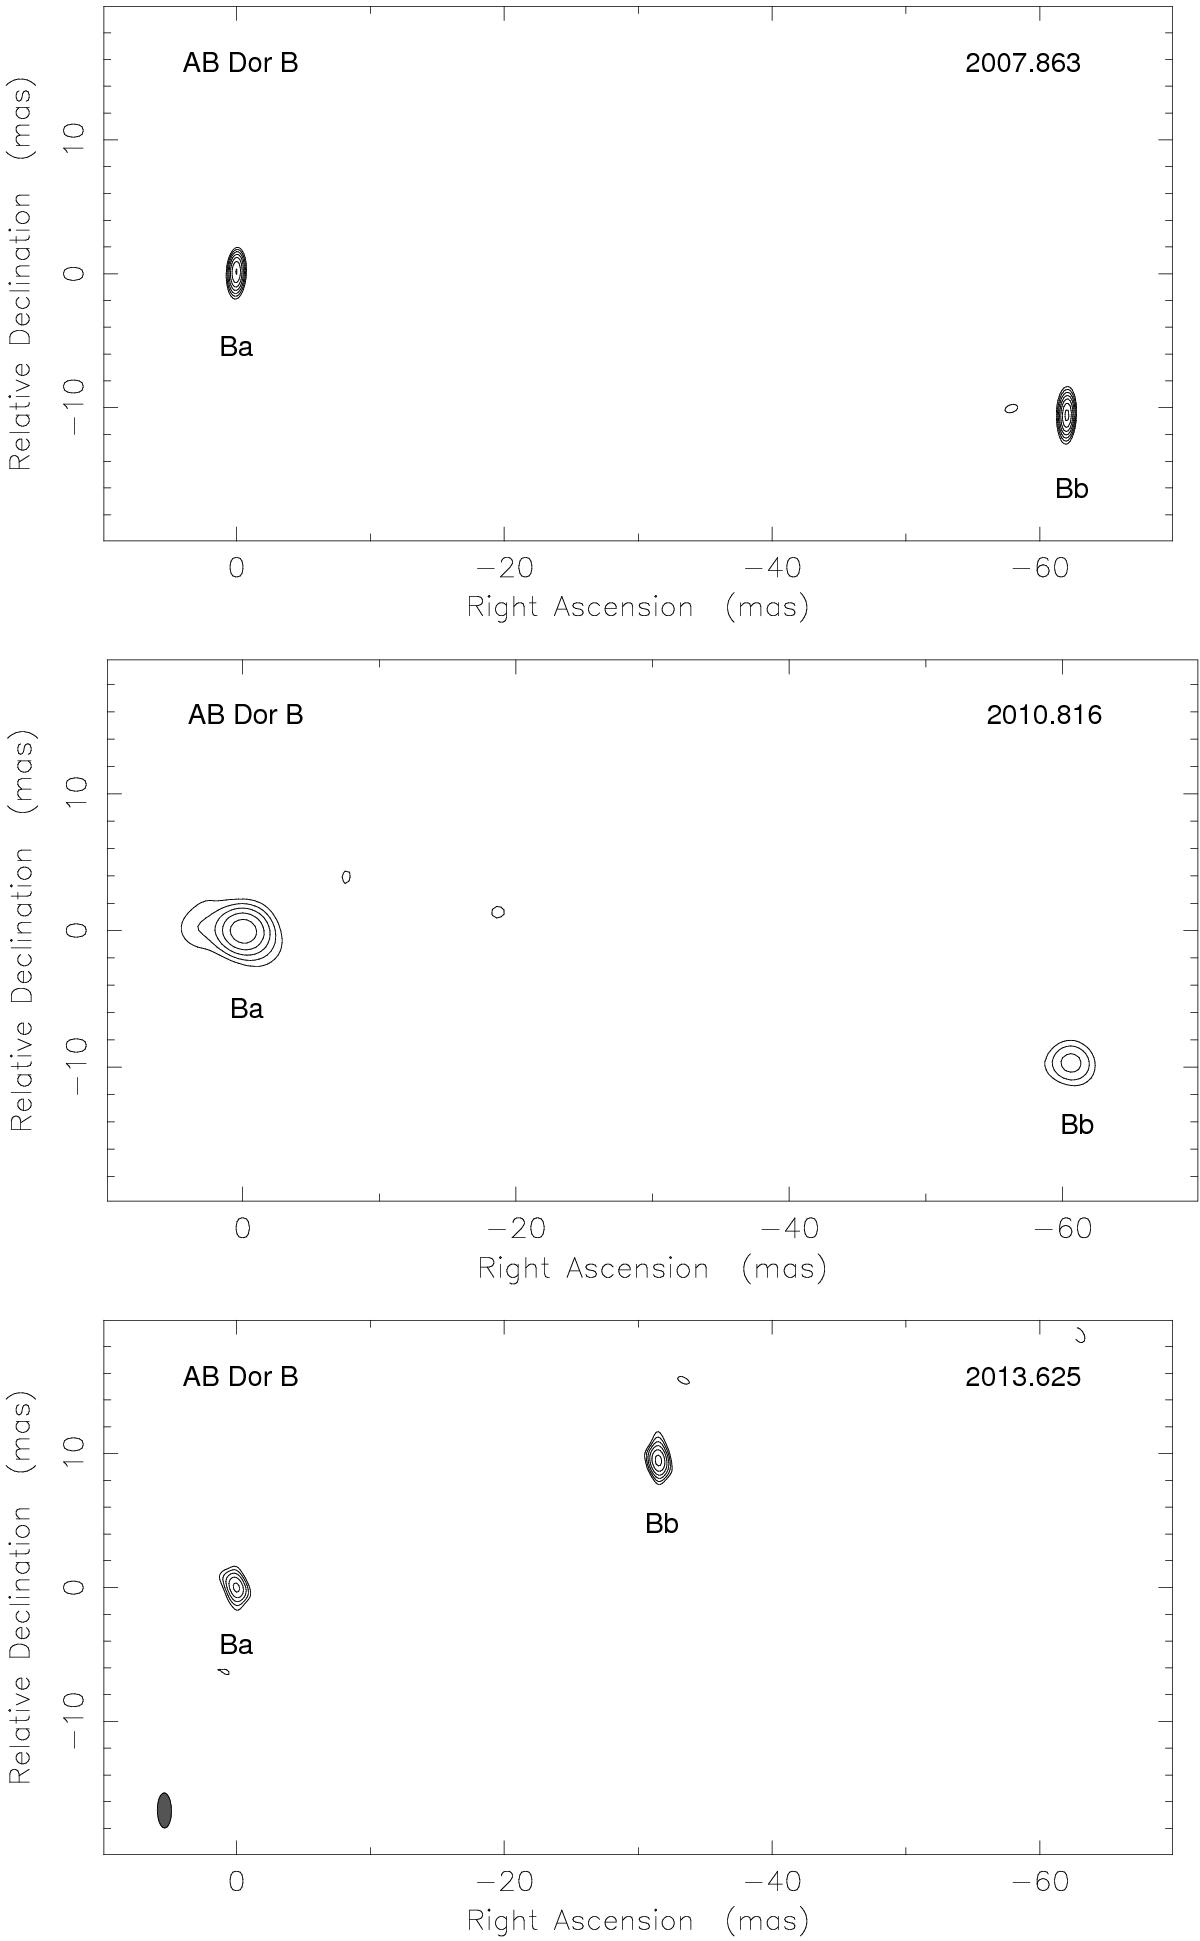
Clean maps of the binary AB Dor B at the three LBA epochs. In each map, the lowest contour level corresponds to 3 times the statistical root-mean-square (0.08, 0.19, and 0.12 mJy beam-1) with a scale factor between contiguous contours of ![]() . The peak flux densities in the images are, respectively, 0.86, 1.25, and 0.89 mJy beam-1. For image parameters see Table 2. In all the maps we have centered the position of AB Dor Ba at the origin. Absolute positions of both Ba and Bb are in Table 3.
. The peak flux densities in the images are, respectively, 0.86, 1.25, and 0.89 mJy beam-1. For image parameters see Table 2. In all the maps we have centered the position of AB Dor Ba at the origin. Absolute positions of both Ba and Bb are in Table 3.
Current usage metrics show cumulative count of Article Views (full-text article views including HTML views, PDF and ePub downloads, according to the available data) and Abstracts Views on Vision4Press platform.
Data correspond to usage on the plateform after 2015. The current usage metrics is available 48-96 hours after online publication and is updated daily on week days.
Initial download of the metrics may take a while.