Free Access
Fig. 6
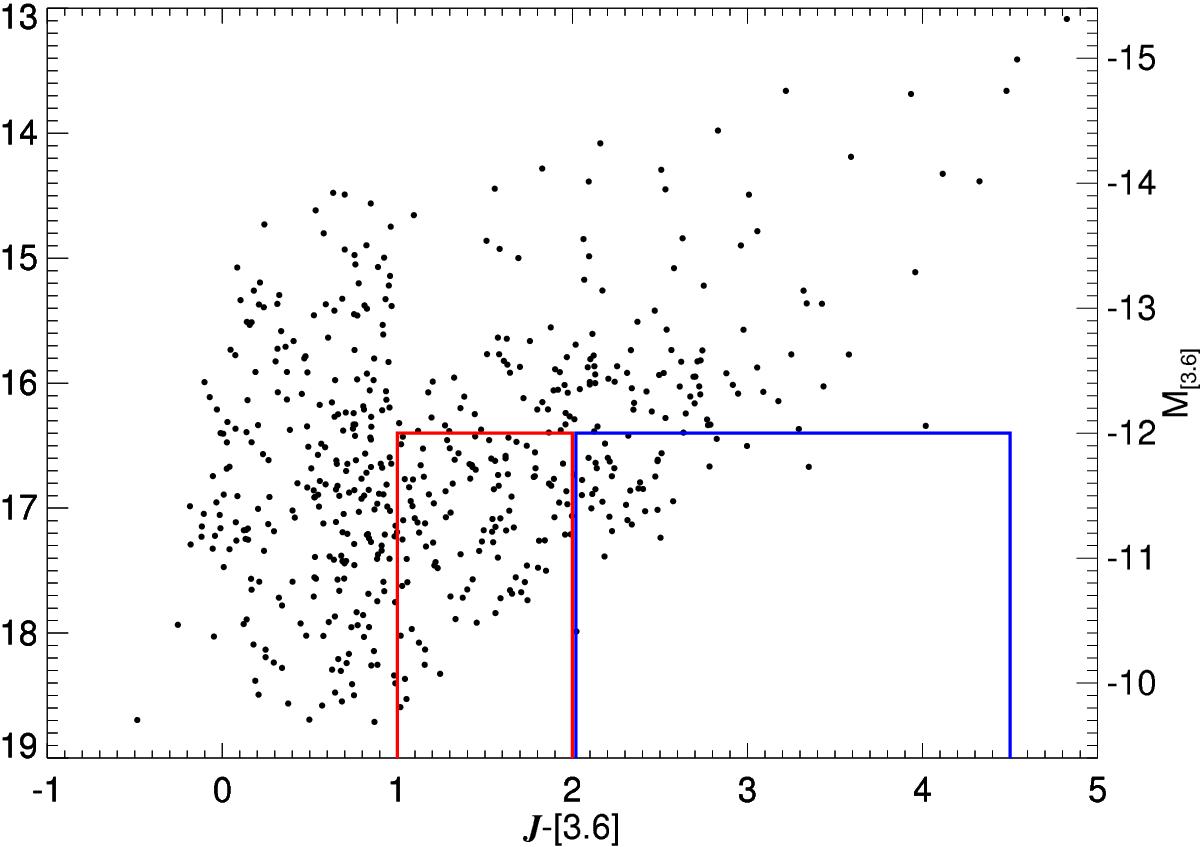
Color−magnitude diagram of [3.6] vs. J −[3.6] for targets in the Spitzer and near IR combined catalog. Regions of specific classes of stars as seen in Fig. 3 of Bonanos et al. (2009, 2010) are outlined by a red box for RSGs, and a blue box for sgB[e] stars.
Current usage metrics show cumulative count of Article Views (full-text article views including HTML views, PDF and ePub downloads, according to the available data) and Abstracts Views on Vision4Press platform.
Data correspond to usage on the plateform after 2015. The current usage metrics is available 48-96 hours after online publication and is updated daily on week days.
Initial download of the metrics may take a while.