Fig. 7
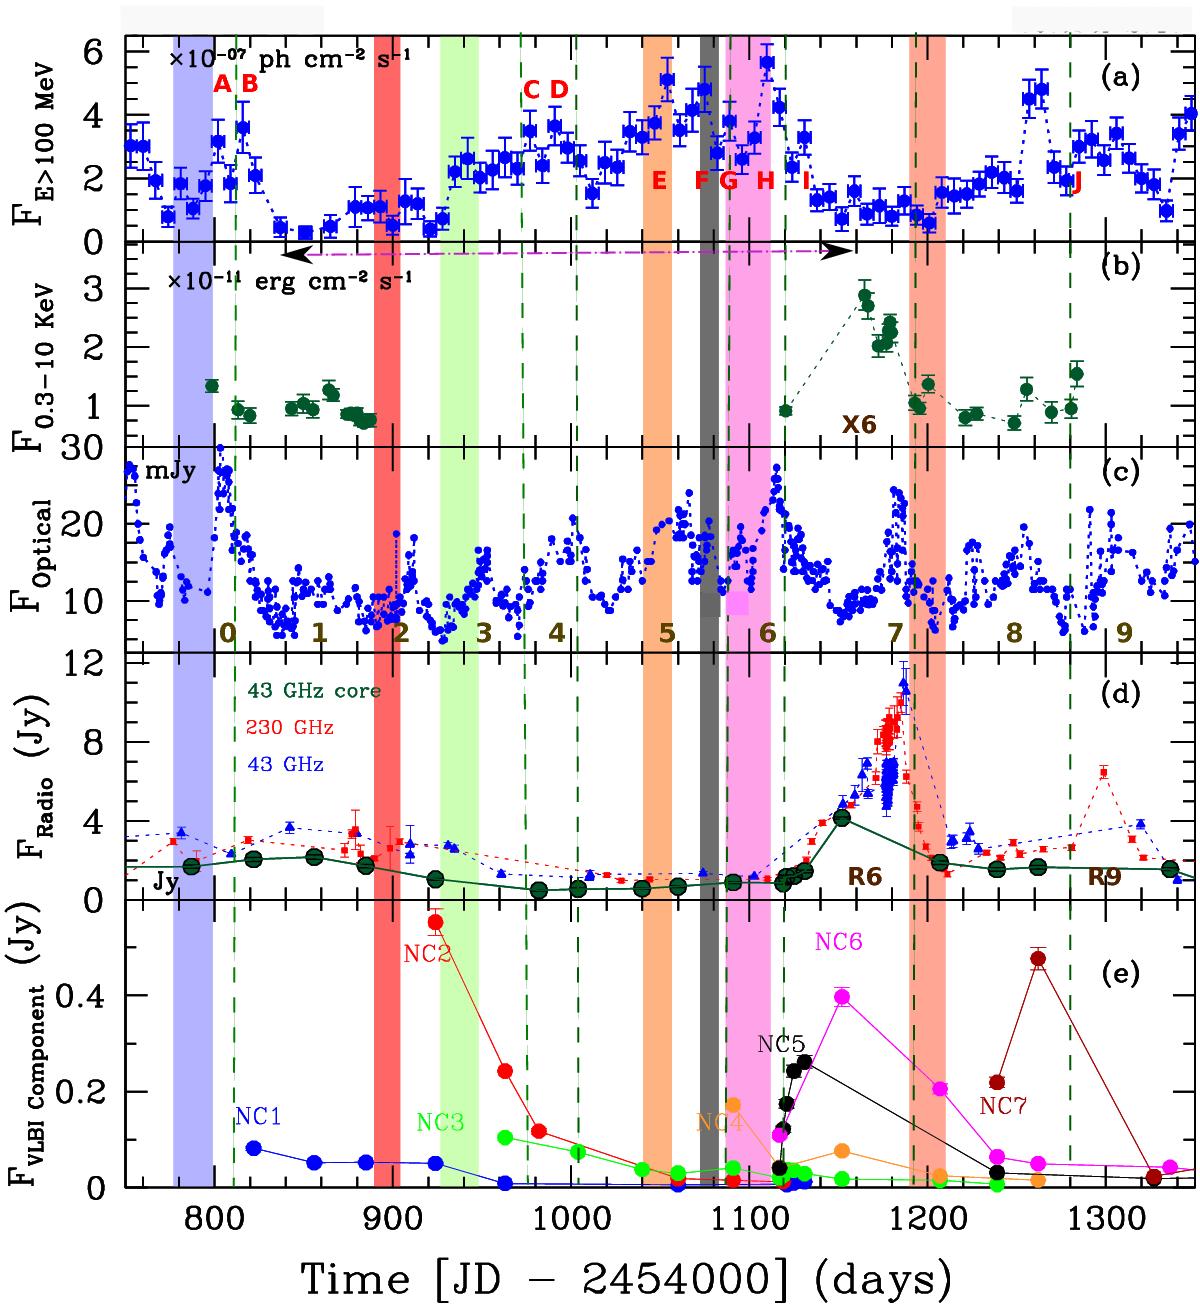
Broadband flux light curves of S5 0716+714: a) weekly averaged γ-ray flux light curve at E> 100 MeV; b) X-ray light curve at 0.3−10 keV; c) optical V-band light curve; d) single-dish (43 and 230 GHz) and 7 mm VLBI core flux light curves; and e) flux density curves of moving jet components shown in different colors. The same color is used to shade their respective ejection times, i.e., epochs of zero separation from the core. The green dashed lines indicate the average times when moving components cross the stationary feature at ~0.15 mas. The major outburst is marked with a horizontal arrow; the faster repetitive optical flares are labeled as “0” to “9” and sharp γ-rays flares as “A” to “J” (see text for details).
Current usage metrics show cumulative count of Article Views (full-text article views including HTML views, PDF and ePub downloads, according to the available data) and Abstracts Views on Vision4Press platform.
Data correspond to usage on the plateform after 2015. The current usage metrics is available 48-96 hours after online publication and is updated daily on week days.
Initial download of the metrics may take a while.