Fig. 1
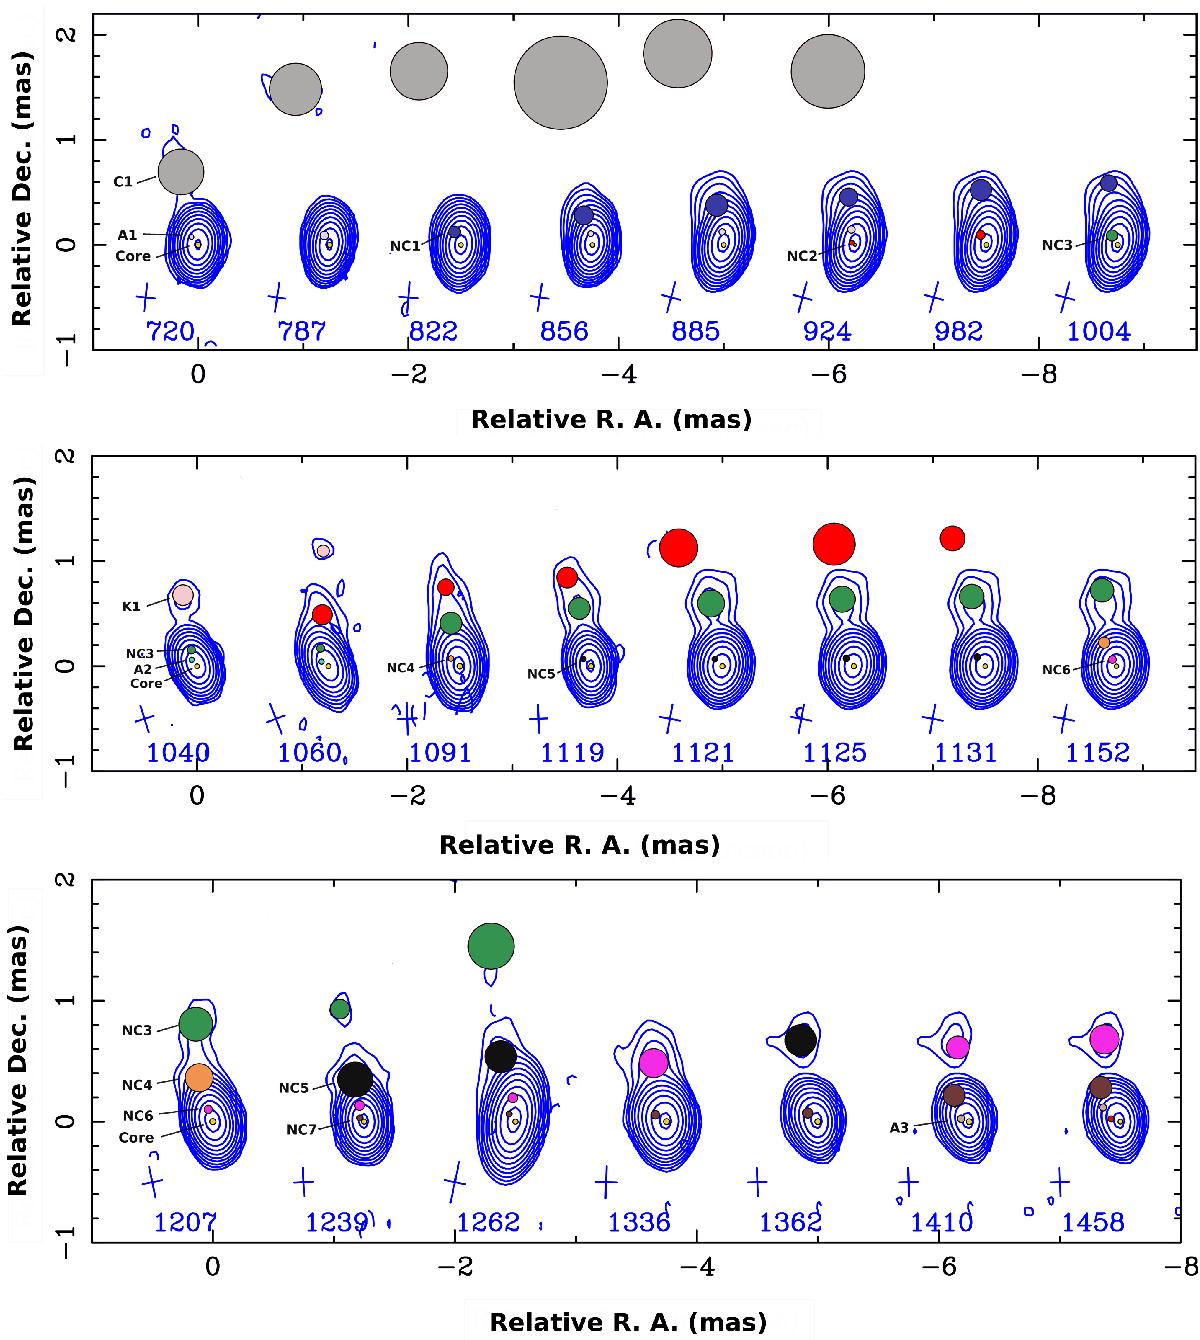
43 GHz VLBA images (contours) and Gaussian components of S5 0716+714 at different epochs between September 2008 and October 2010. The date of observation is given at the bottom of each map (shifted Julian day, JD−2 454 000). The fitted model parameters for each epoch are given in Table A.1. The cross at the bottom of each map represents the FWHM of the restoring beam (0.25 × 0.18 mas). Contour levels correspond to −0.003 0.003 0.006 0.012 0.024 0.048 0.096 0.19 0.38 0.76 1.54 3.07 6.14 12.28 24.58 49.15 98.30 mJy/beam.
Current usage metrics show cumulative count of Article Views (full-text article views including HTML views, PDF and ePub downloads, according to the available data) and Abstracts Views on Vision4Press platform.
Data correspond to usage on the plateform after 2015. The current usage metrics is available 48-96 hours after online publication and is updated daily on week days.
Initial download of the metrics may take a while.