Fig. 7
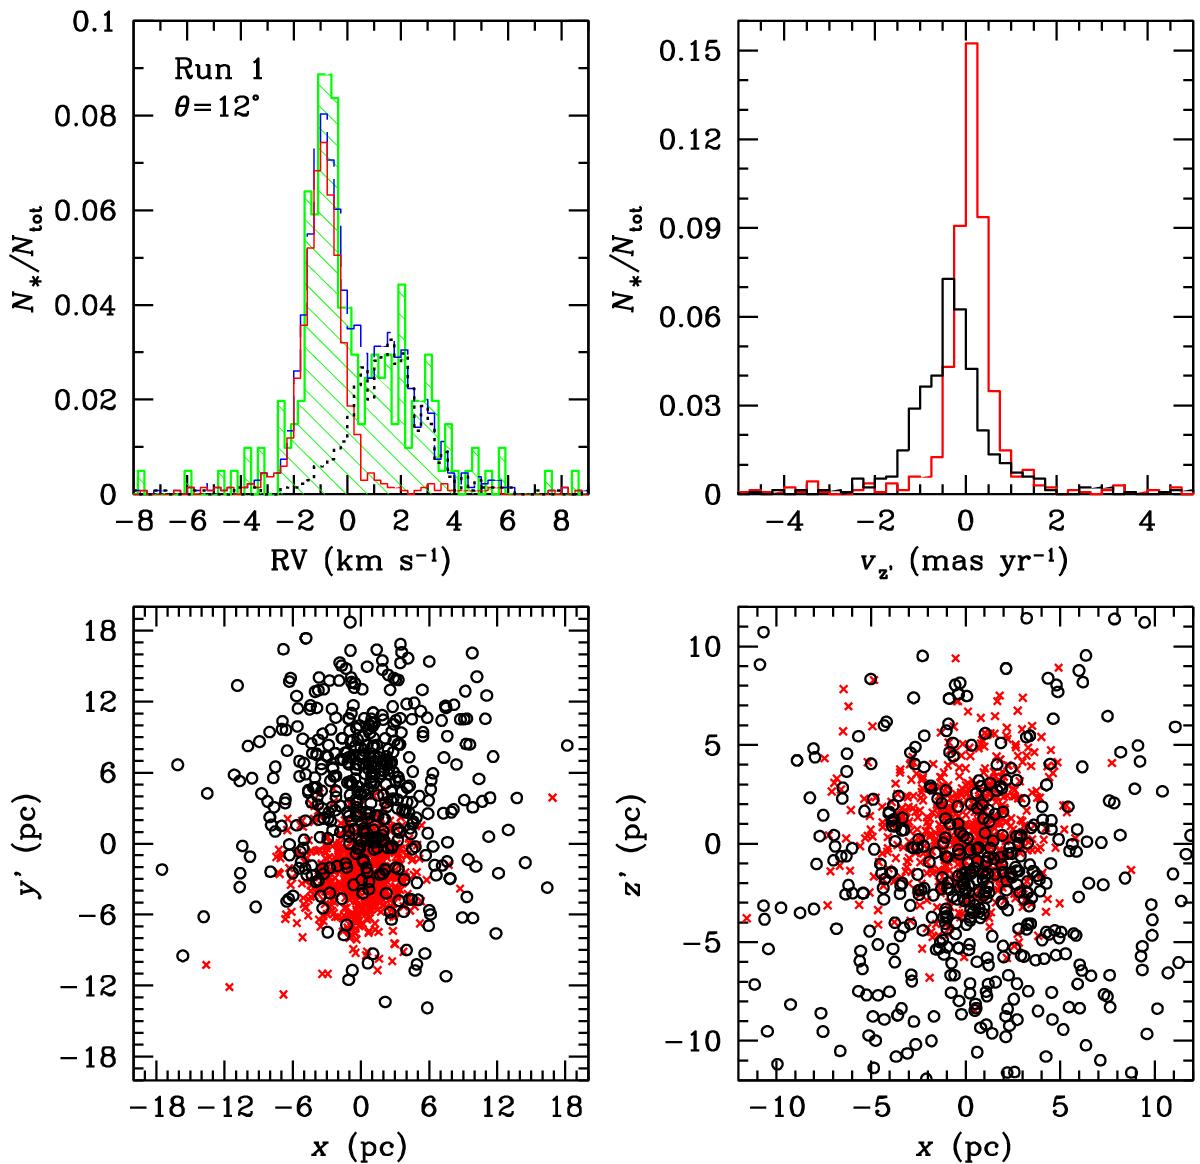
Properties of run 1 (at t = 4.8 Myr) if rotated by an angle θ = 12° about the x axis. Top left-hand panel: RV distribution (symbols are the same as in Fig. 2); top right-hand panel: distribution of proper motions along z′ (symbols are the same as in the marginal histograms of Fig. 3, in particular pop. A and pop. B correspond to the red and black histogram, respectively); bottom left-hand panel: positions in the xy′ plane (symbols are the same as in Fig. 1, in particular pop. A and pop. B correspond to red crosses and black open circles, respectively); bottom right-hand panel: positions in the xz′ plane (symbols are the same as in Fig. 5, in particular pop. A and pop. B correspond to red crosses and black open circles, respectively).
Current usage metrics show cumulative count of Article Views (full-text article views including HTML views, PDF and ePub downloads, according to the available data) and Abstracts Views on Vision4Press platform.
Data correspond to usage on the plateform after 2015. The current usage metrics is available 48-96 hours after online publication and is updated daily on week days.
Initial download of the metrics may take a while.